From Prototype to Production: Rebuilding the Proximity Platform

The context
For my final year project at ESI Algiers, I spent nine months on one system: the Proximity Platform. It is a hyperlocal e-commerce platform that gives a neighbourhood’s local shops, producers and service providers the same online reach as the big retailers such as Zara, Amazon and eBay, instead of showing every shop and product that matches your search, it puts the nearby ones first. Distance isn’t a filter to turn on, it’s built into how everything is sorted from the start.
The cover photo is me on the left with my friend Mehdi. He suggested I write it up as a blog post, so here is the short version.
Proximity is a live research case study at LIRMM (CNRS and University of Montpellier) on how to reuse, re-engineer, migrate and evolve microservices, and my role was to turn the prototype into a real production system. I was supervised by Dr. Abdelhak-Djamal Seriai (LIRMM) and Dr. Soumia Zellagui (ESI). On July 1st, 2026 I defended two dissertations and graduated with both degrees on the same day.
Both dissertations start from the same method: a three-part audit of the system I inherited. (A software audit is a structured, evidence-based review that grades a system against a defined standard rather than on personal opinion.) A quality audit came first, examining security, reliability, and maintainability against ISO/IEC 25010, the international standard that defines what software quality means, plus how well the code was tested, to establish whether the foundation was solid enough to build on. A functional audit came next, comparing what the specification promised with what the code actually did. An operational audit came last, asking one simple question: can this system even be built, deployed, monitored, and run at all? Each audit gave me a list of gaps, and each list became a phase of work.
So the work ran in four phases, in this order: the audit, then quality re-engineering, then functional evolution, then DevOps and observability. The logic behind the ordering was strict: you need a solid base before you evolve it, and working features before you deploy them. So no new feature was written until every inherited service passed a high quality bar, and nothing was deployed or observed before those features existed.
The platform has a lot of features and a rich business logic and it serves roles in a creation hierarchy: Admin, SuperManager, Manager, Seller, Client, a Payment Manager who handles cash payments, and the System itself. They reach it through four Flutter apps. Behind the apps sit 15 Node.js services, with Kafka as the event bus and one database per service.
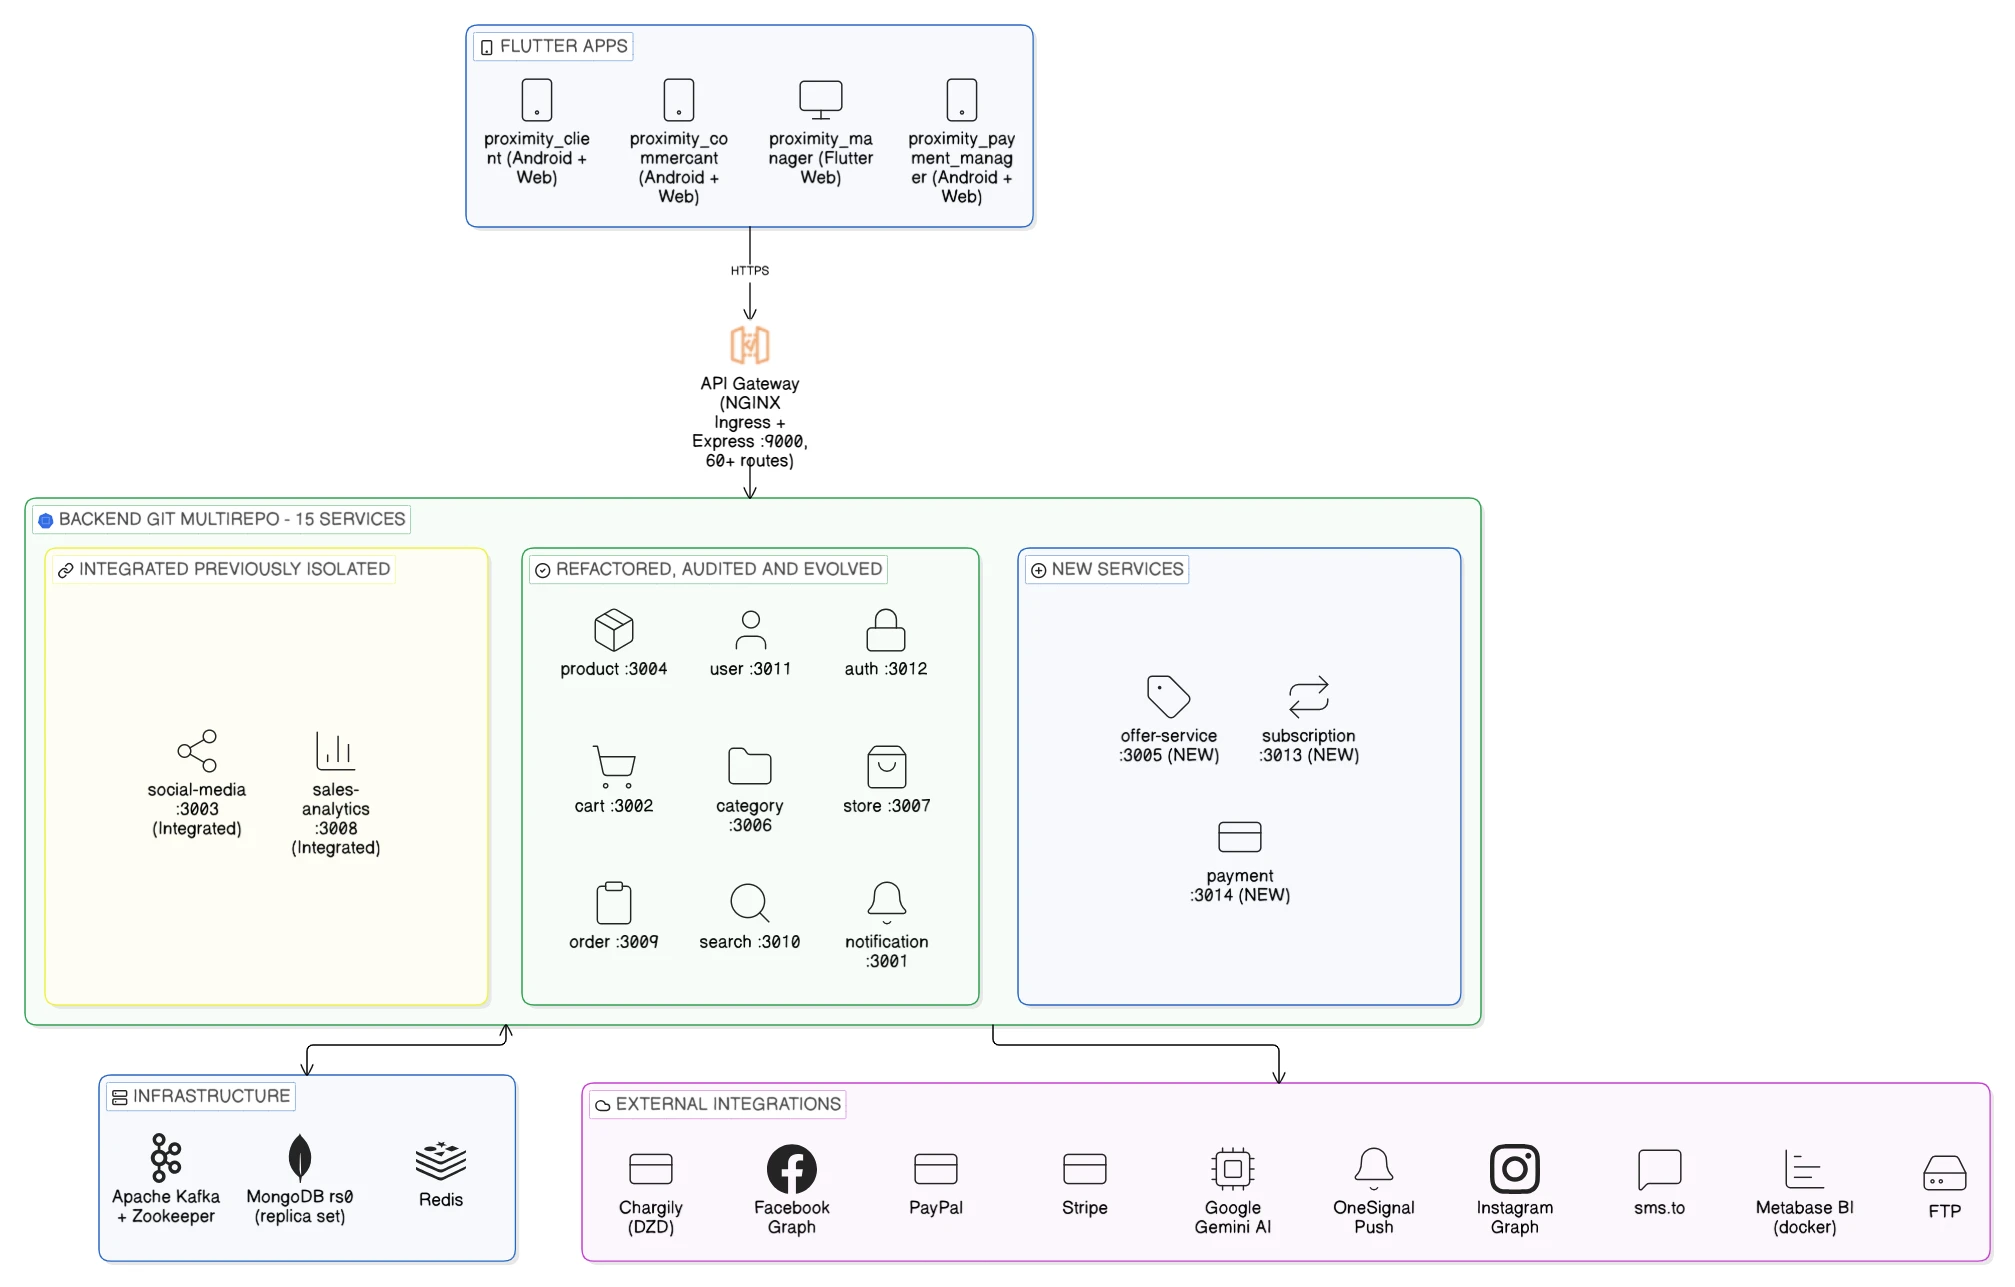 Figure 1: the delivered architecture.
What the audit found
The codebase was handed to me as production-ready. The functional audit put it at about 20% of the planned product, and the quality audit said that 20% was not safe to build on, deployment didn’t exist even.
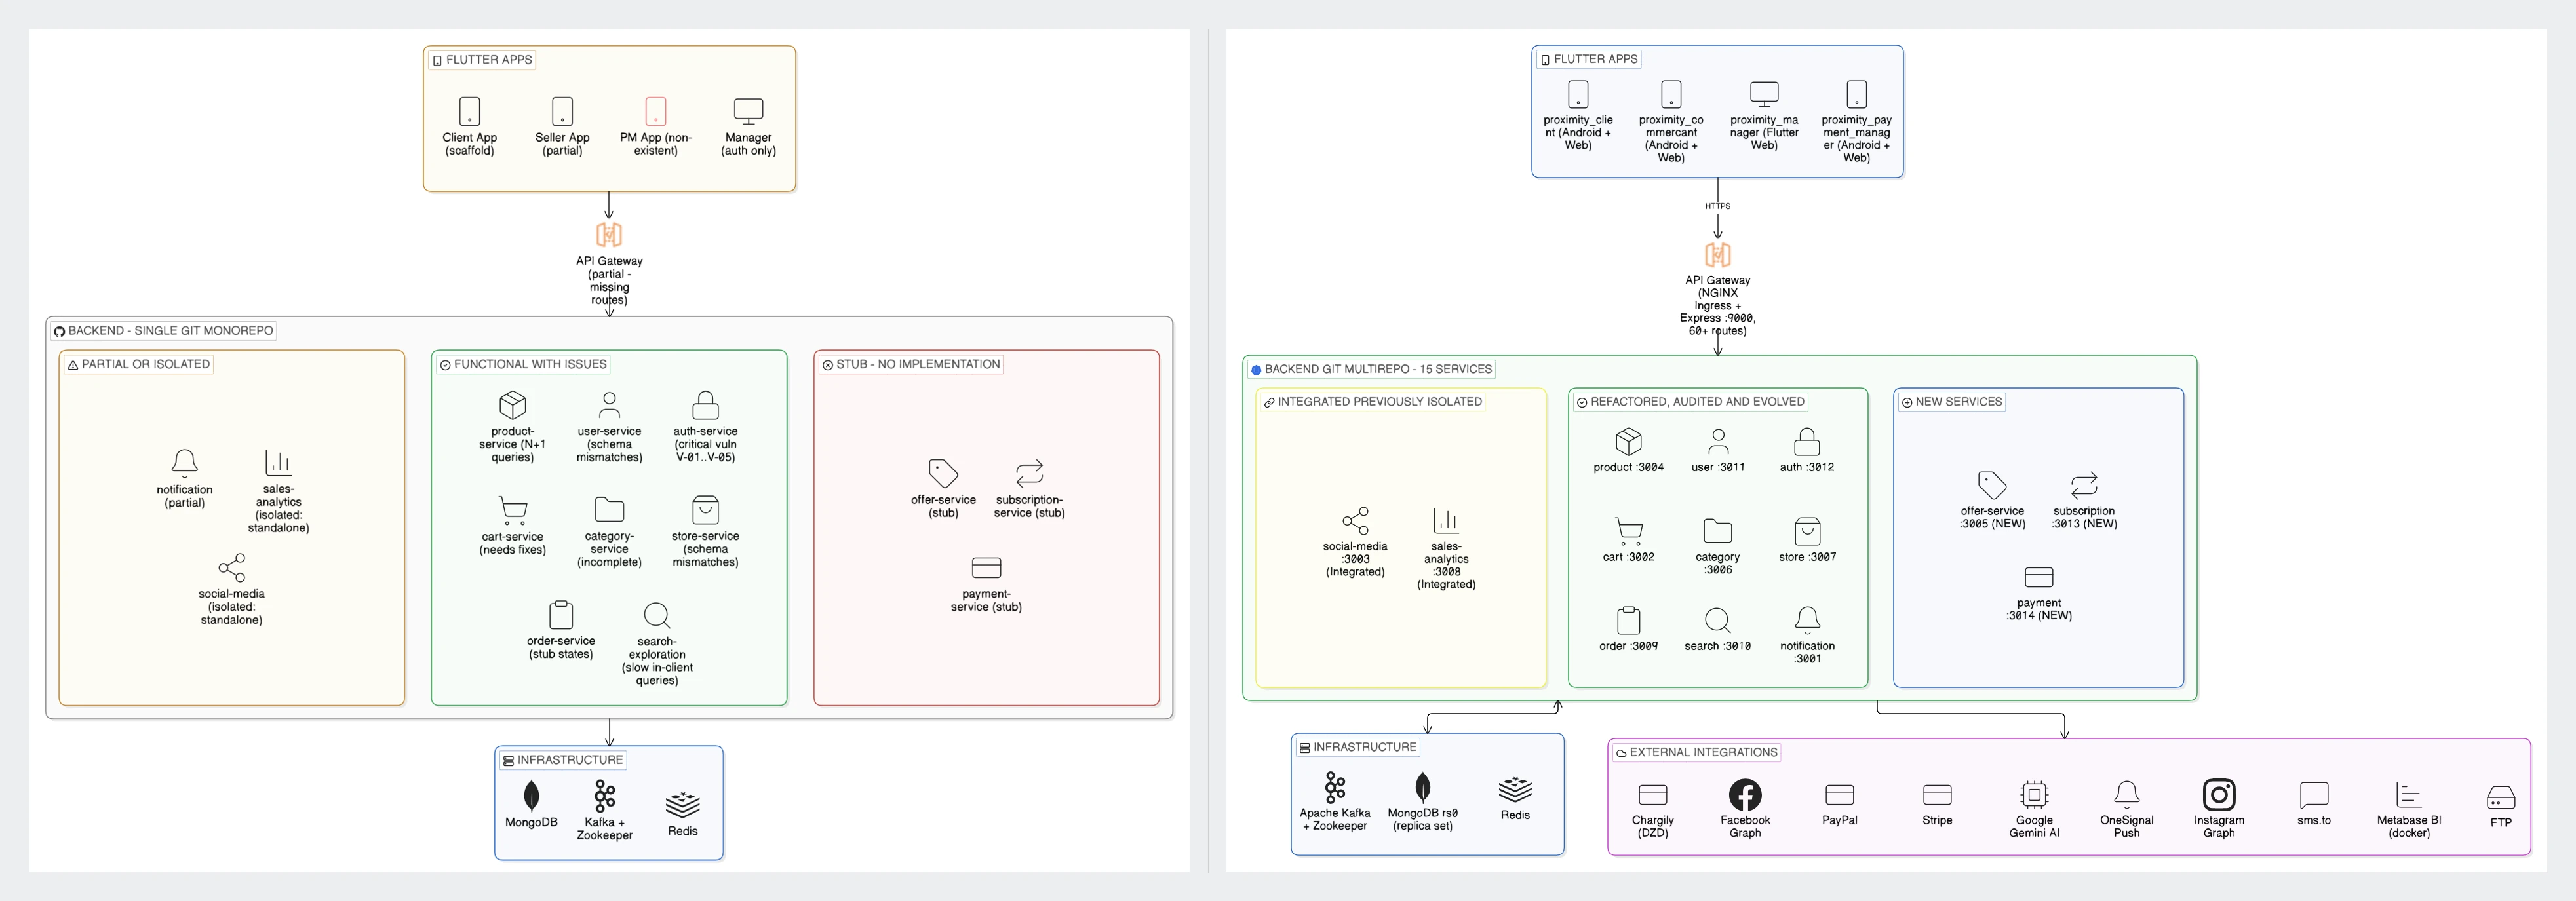 Figure 2: what I inherited on the left, what I delivered on the right.
The quality audit found 25 security problems, several of them serious. The worst one let someone bypass the login completely. There was also a less obvious kind of bug: in several services the database schema and the code writing to it did not agree on field names, and when they disagree the write is silently dropped, with no error and no warning. On top of that, one shared login component had been copy-pasted into 13 repositories, and each copy had slowly changed until it no longer matched the others, so fixing one did nothing for the rest.
The operational audit was the shortest and the most worrying. No tests. No API documentation. No working container image. No CI/CD. No monitoring. The whole thing was deployed from a laptop.
Quality first
The quality phase ran as eight clean-up rounds, ordered by risk and dependency, not by ease: security first, then the silent data-loss bugs, then fixing the schemas (you cannot write useful tests against a schema that is still wrong), then pulling the shared code into one place, then logging, and finally performance. Tests came last, once the code they cover had stopped changing.
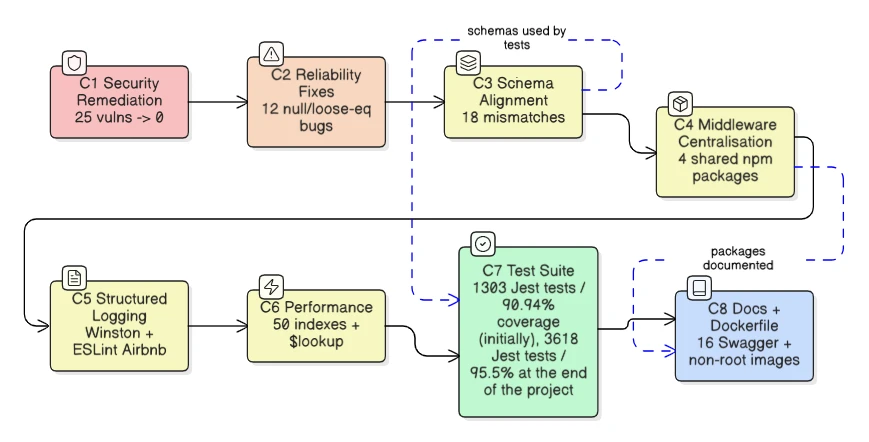 Figure 3: the eight clean-up rounds, in risk order.
Those 13 copies changed the design. Instead of patching each one, I moved the shared concerns every service needs, like authentication and logging, into four small versioned packages. Now every service depends on those packages instead of carrying its own copy.
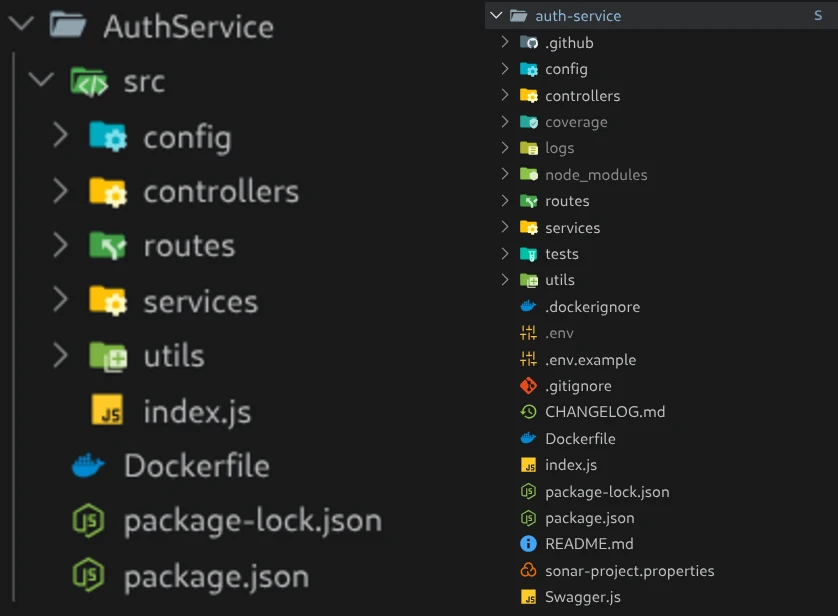 Figure 4: the auth service folder, before and after.
I wrote 3,618 automated tests from nothing. They use mocks, so the whole suite runs in under 30 seconds without a real database.
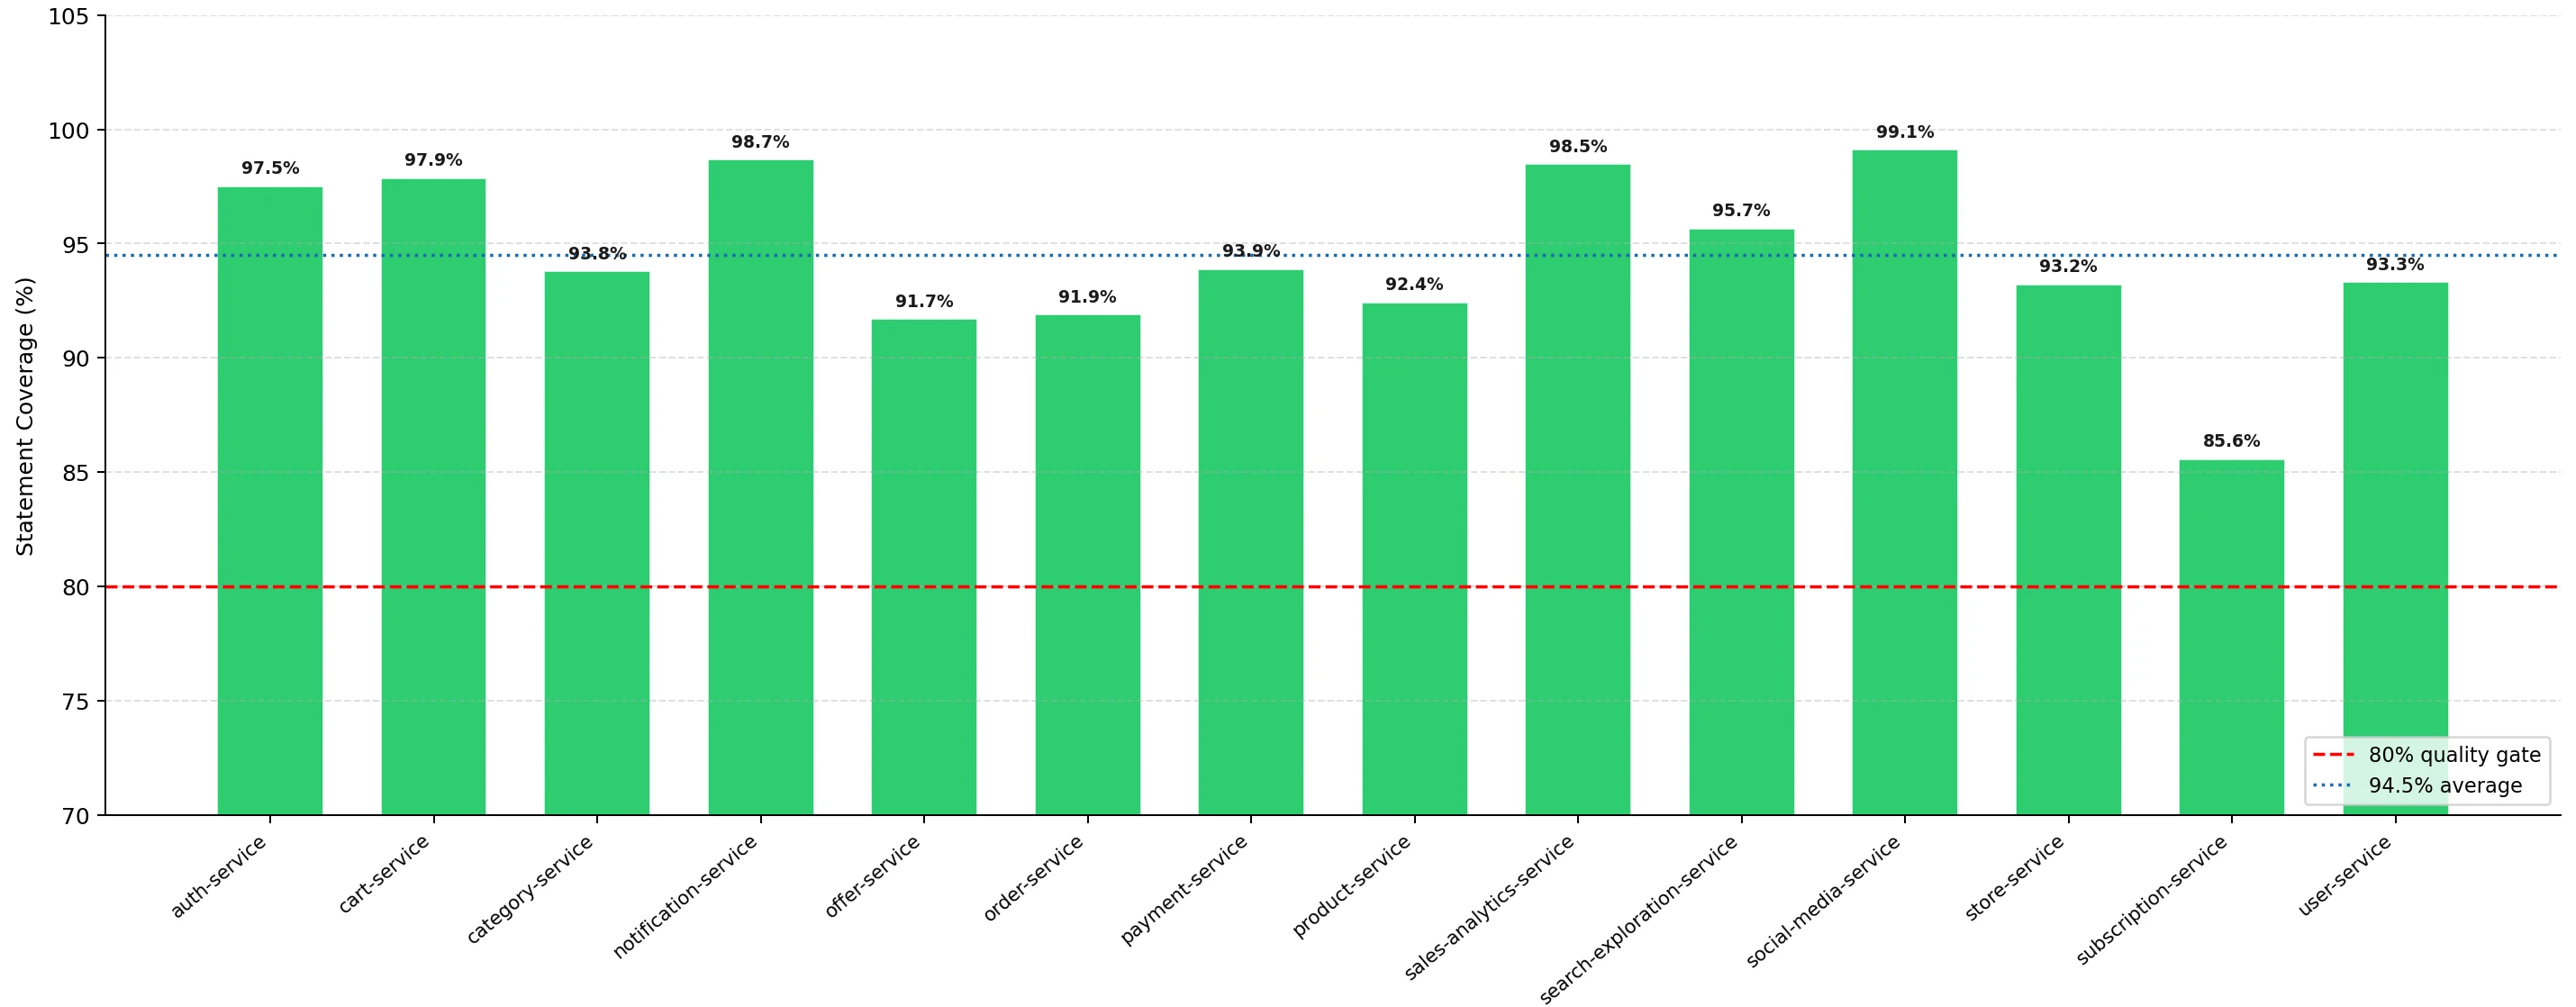 Figure 5: coverage per service against the 80% gate.
Tests and clean code are only worth something if they stay that way. So I added a quality gate: an automatic check every repository must pass before its code moves forward. SonarQube enforces it, scoring each service against ISO/IEC 25010 and surfacing the quality issues to fix. It checks every push the same way, no matter who wrote it. If test coverage drops, or a new security issue appears, the gate blocks the change until it is fixed. Quality stops depending on people remembering to be careful, and a new developer’s code is held to the same bar from day one. Before this, every service except the gateway scored E for security and had zero test coverage. After the clean-up, all 15 services scored A for security, reliability, and maintainability, the three ISO/IEC 25010 ratings SonarQube reports.
 Figure 6: SonarQube before and after the clean-up.
Functional evolution
Phase 3 built what the functional audit found missing. The missing services were built from scratch (payment, subscription, promotions, recommendations, business intelligence, and social media), the half-finished ones were completed, and the four mobile apps went from empty shells to real apps. Two of the new services are worth calling out: a full social-media layer, so shops and customers can follow each other and share posts instead of only buying and selling, and a business-intelligence service that turns the stream of platform events into the analytics and dashboards managers plan against. Kafka connects the services through events, so when a payment finishes, every service that cares is told automatically.
One design choice came from the real world, not a diagram. Payments run through six providers behind a single interface, and which providers a buyer sees depends on the seller’s currency, because not every provider can handle certain currencies if the platform expanded to other places.
I audited performance the same way. I moved the heavy data crunching into the database instead of multi-level aggregations, cut the repeated round-trips between a service and its database, and added important indexes such as the “Geospatial” ones that help in the quick retrieval of locations. Across the 13 slowest read paths, the average response time dropped from 9.95 seconds to 460 milliseconds after performing a full db-benchmark between the old and new versions.
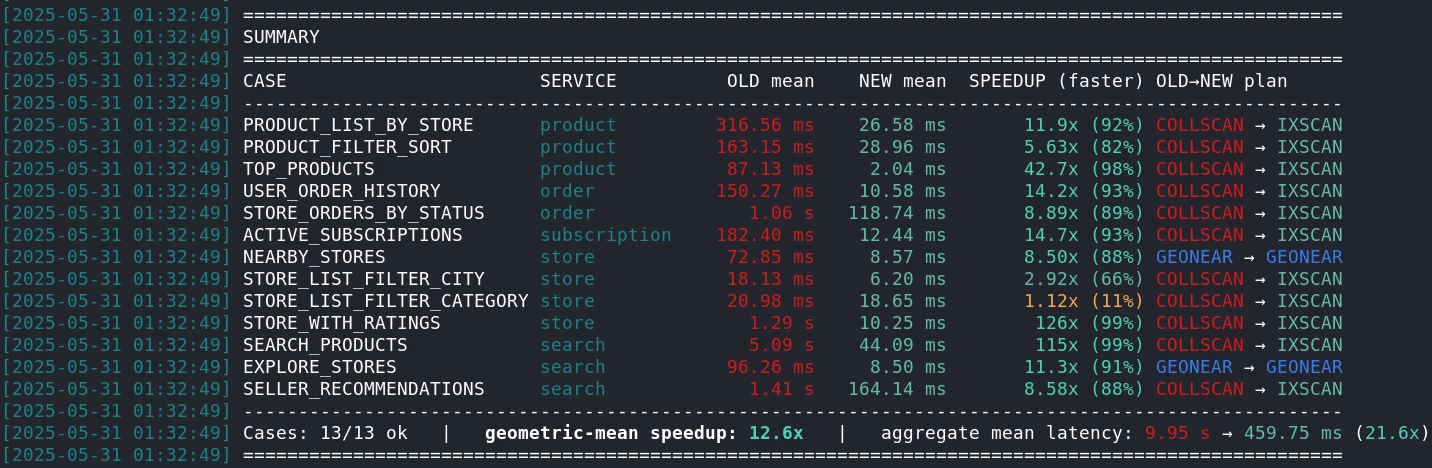 Figure 7: the benchmark, 13 queries, old versus new.
Making it deploy itself
The backend arrived as a single repository holding all 15 services. That meant I could not test, version, or gate one service on its own, and one broken service could block everyone else’s release. So I split each service into its own repository, each with its own history, quality gate, and container image. One umbrella repository ties all 22 of them together.
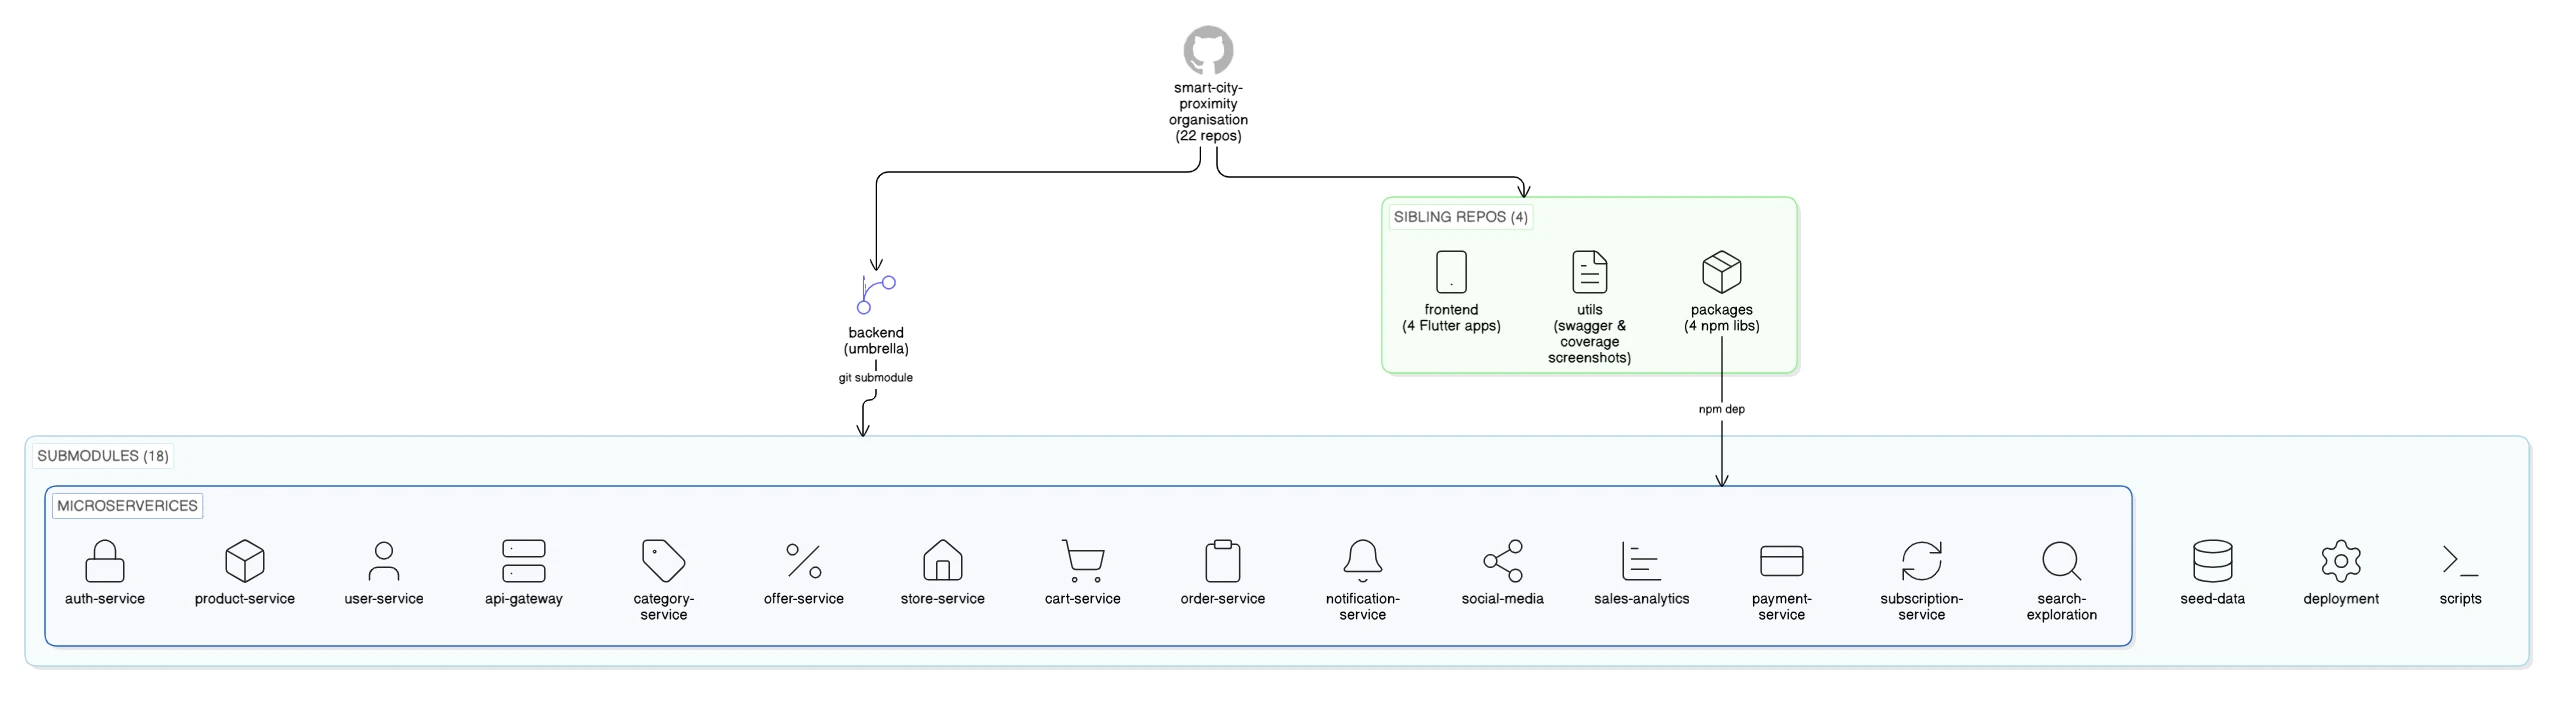 Figure 8: 22 repositories under one umbrella.
Every repository runs the same pipeline on each push: install the dependencies, check them for known security issues, run the tests, run the quality gate, build the container image, then notify the umbrella. Writing 15 nearly identical pipelines by hand was never going to happen, so a small generator creates them all from one template.
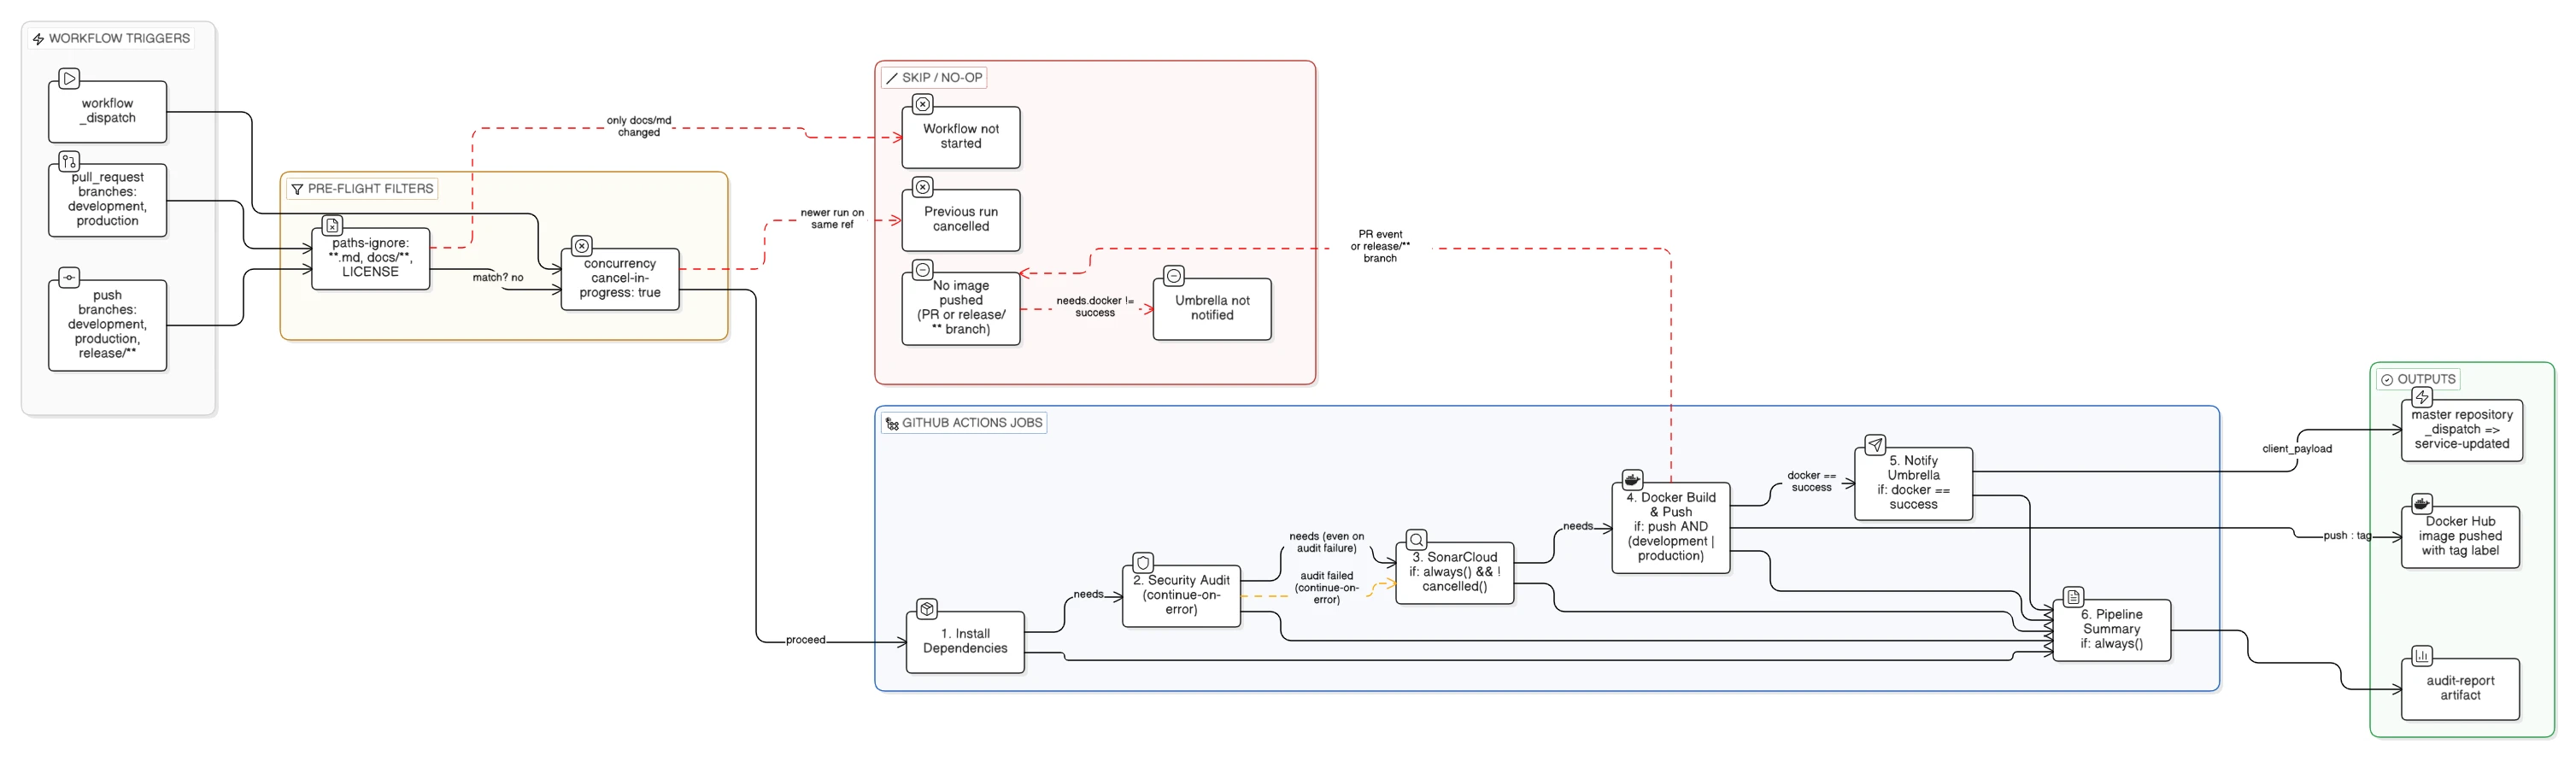 Figure 9: the generated per-service pipeline.
The umbrella decides what each branch is allowed to do. The development branch updates the development server. The production branch, which you can only reach through a reviewed pull request, rolls the change out to the cluster and undoes it automatically if anything goes wrong. Every other branch runs the checks but deploys nowhere.
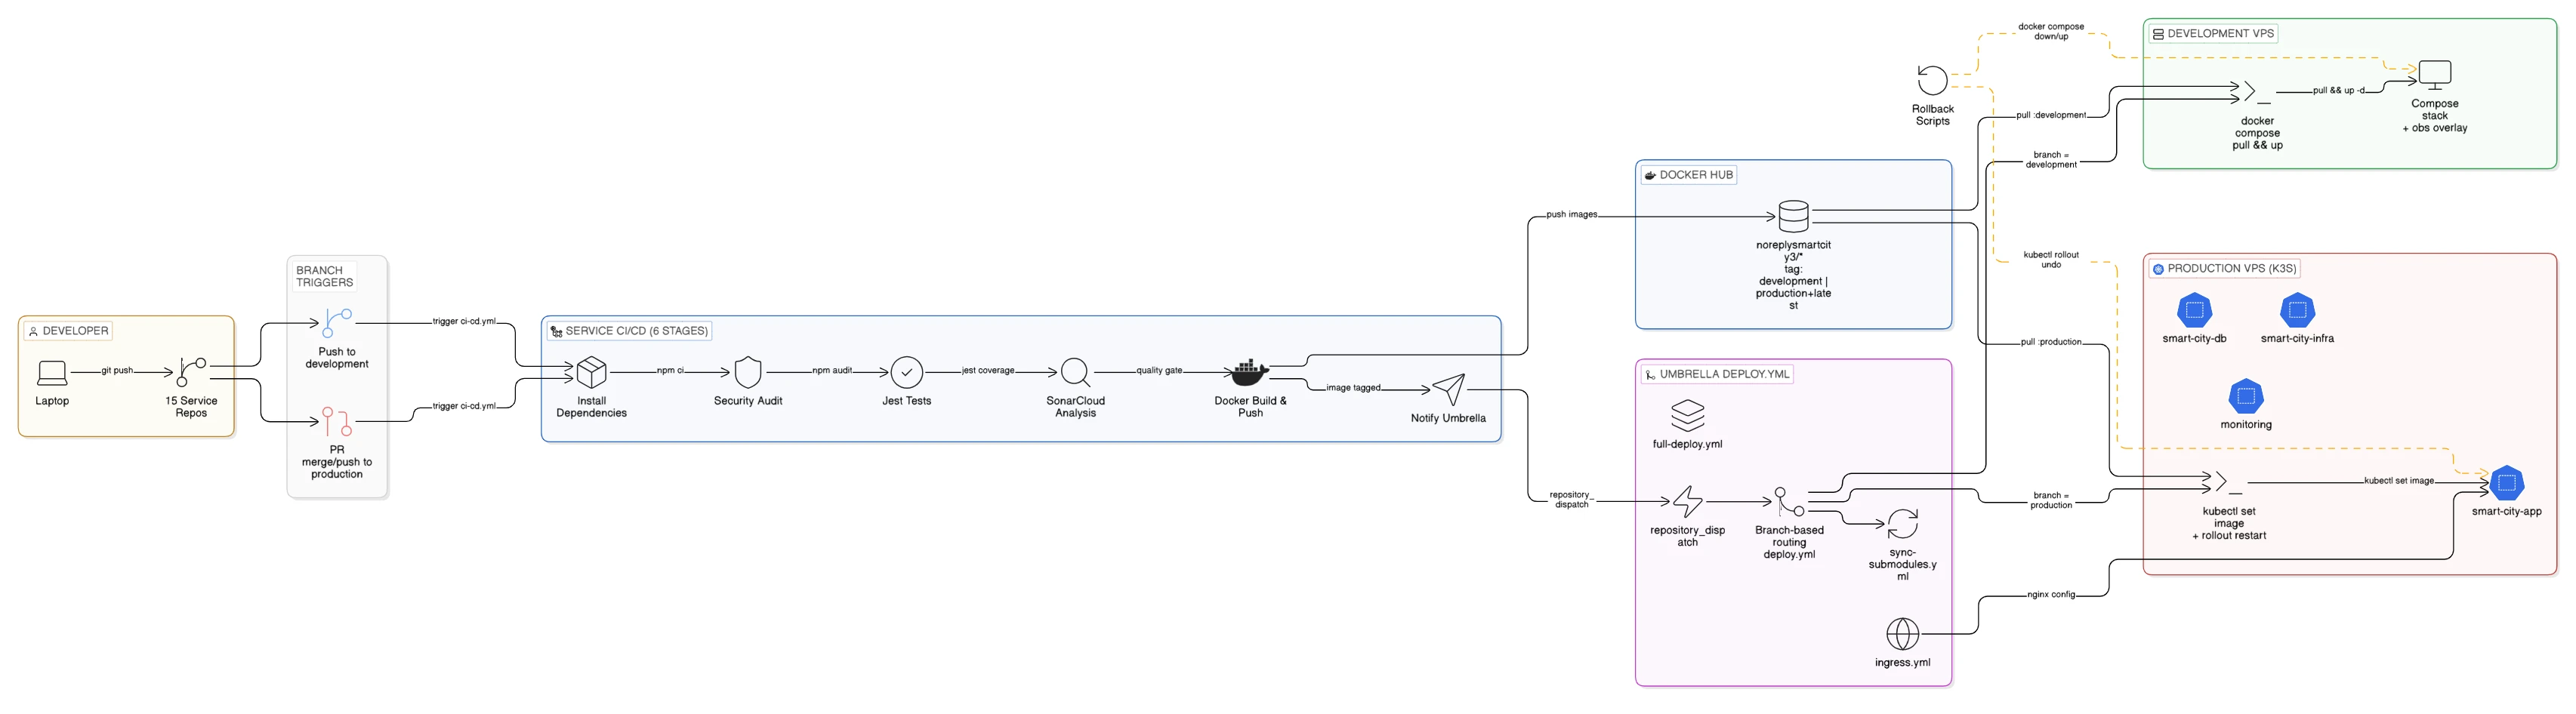 Figure 10: only the production branch reaches the cluster.
Two environments, one configuration
The research lab provided me with two servers and kept them as similar as the budget allowed. Development (with 6 vCPU, 12 GB RAM, 100 GB NVMe) runs the full stack with Docker Compose. Production (with 12 vCPU AMD EPYC, 48 GB RAM, 250 GB NVMe) runs on a single-node Kubernetes cluster with replication set for each microservice and container as needed. I knew the trade-off of the single-node I was making. The same layout works on a multi-node cluster without changes, so scaling out later just means adding machines.
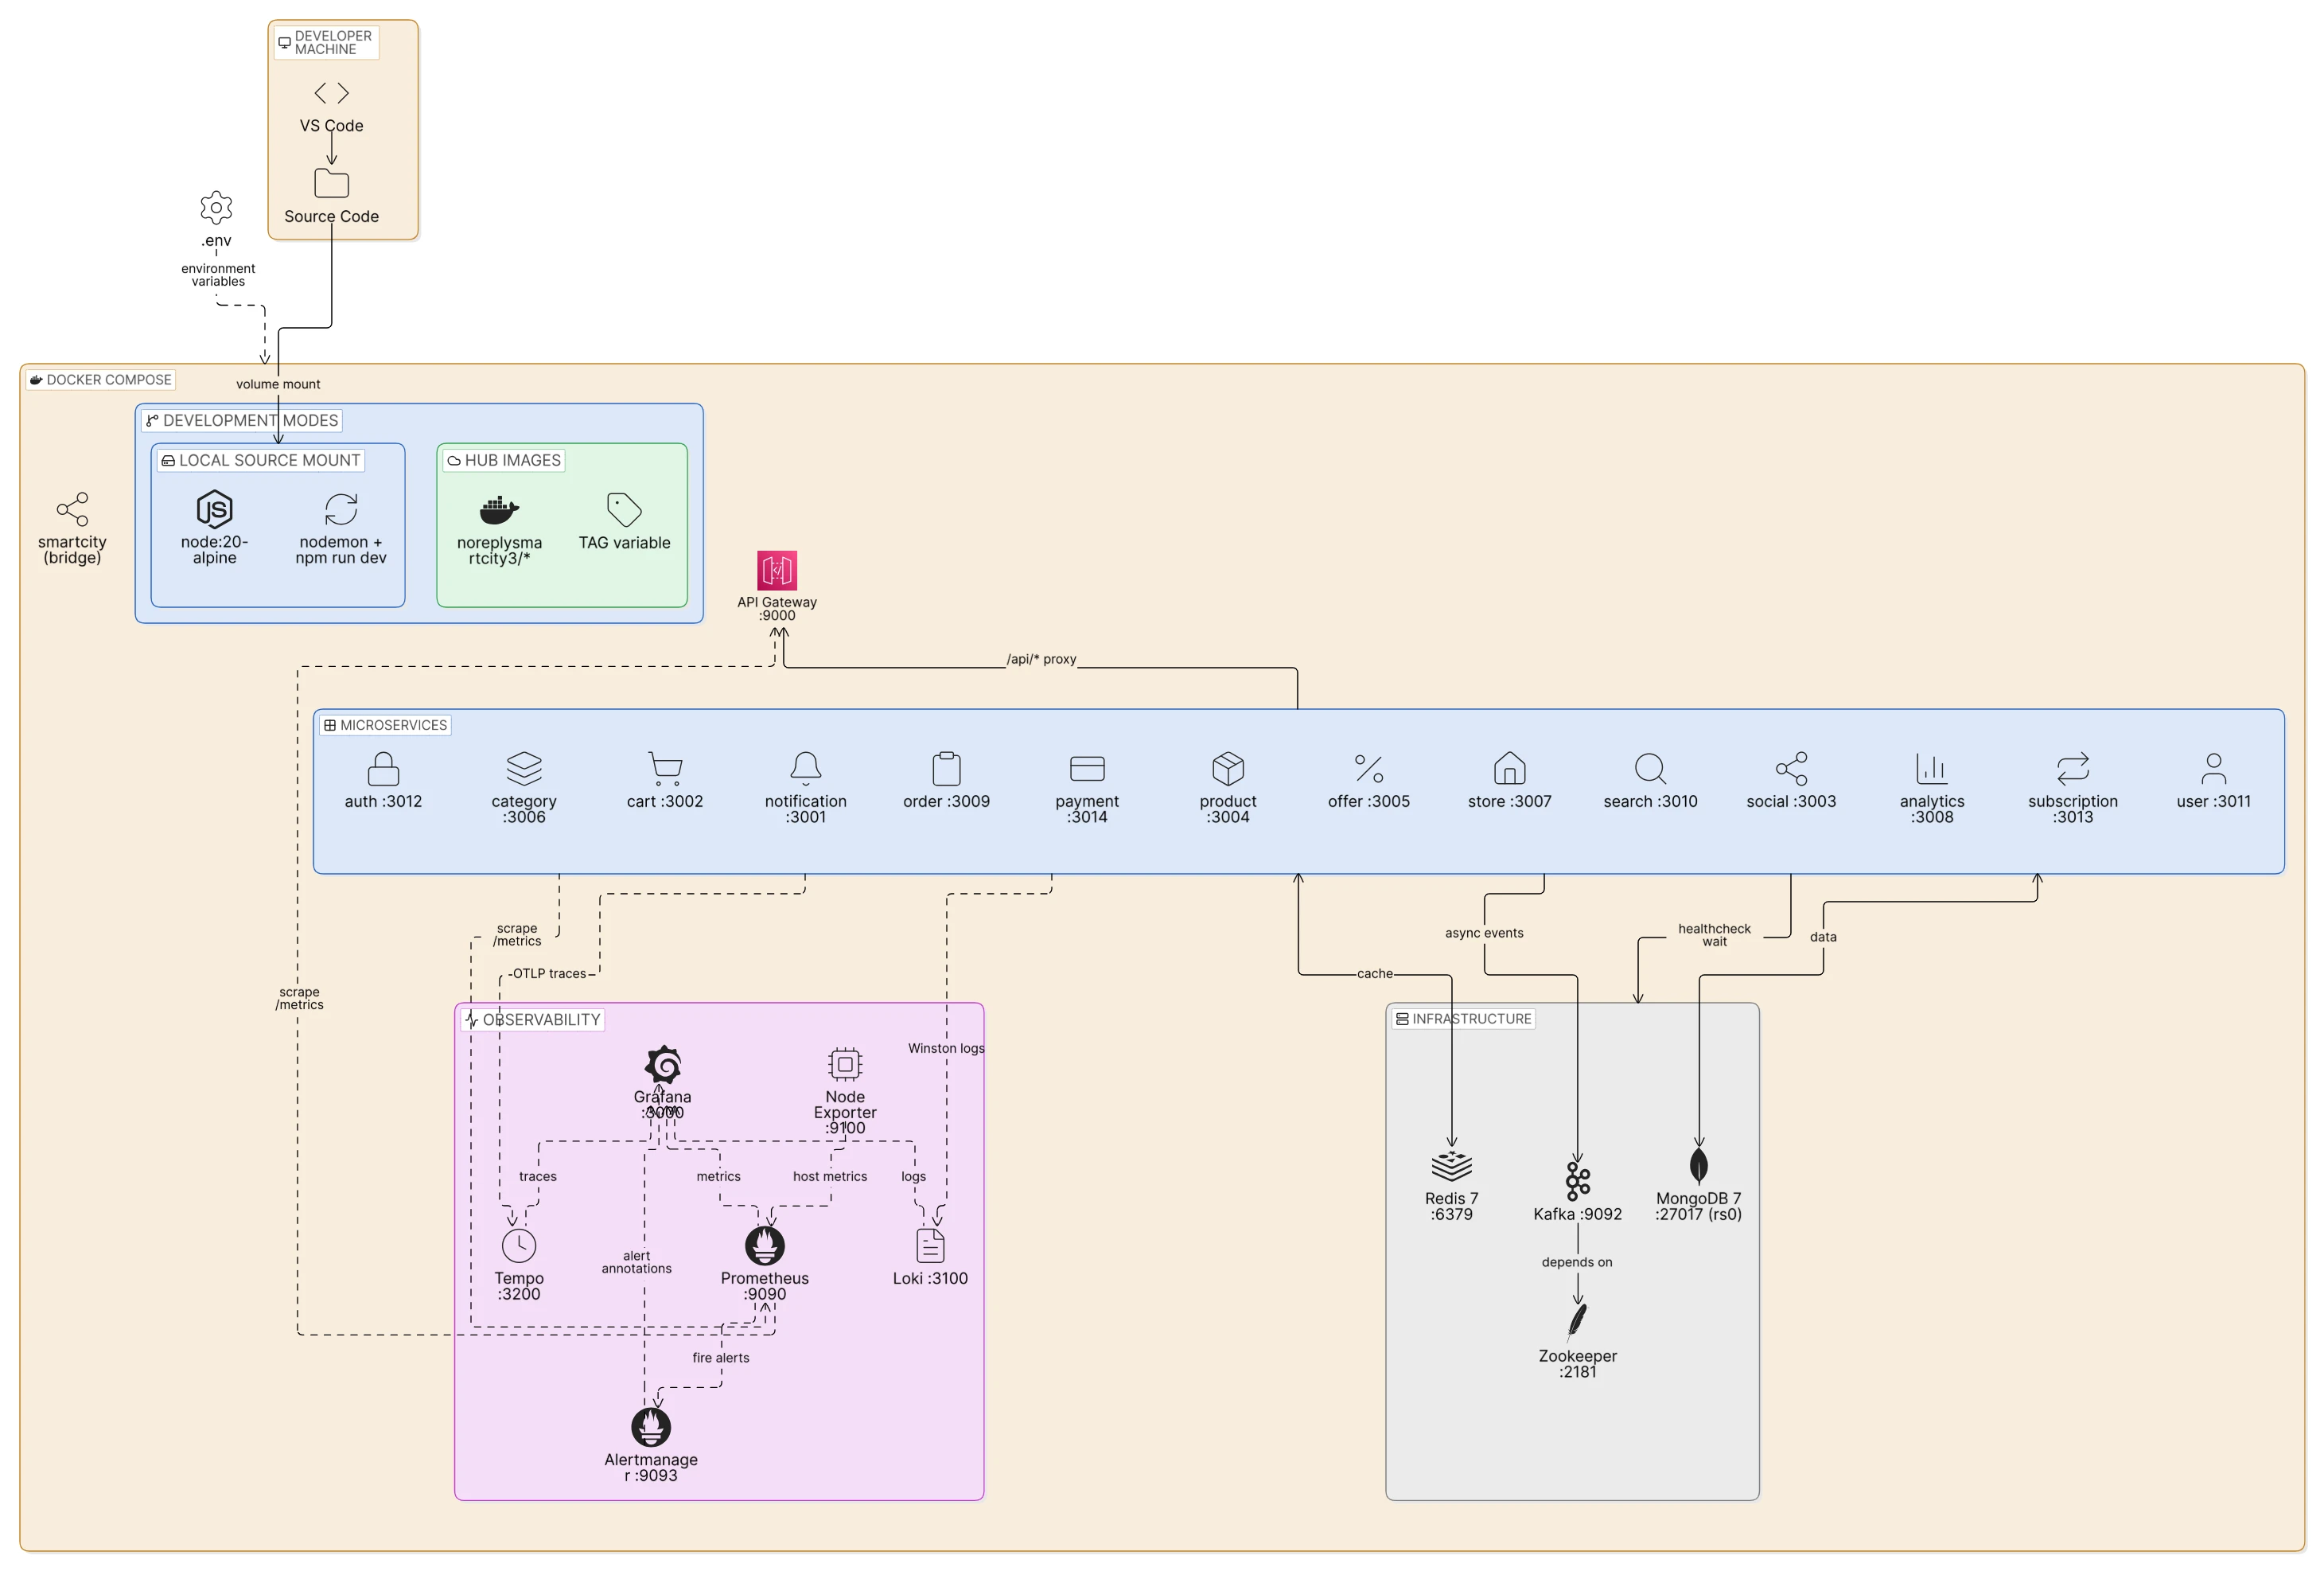 Figure 11: development, one Docker Compose stack.
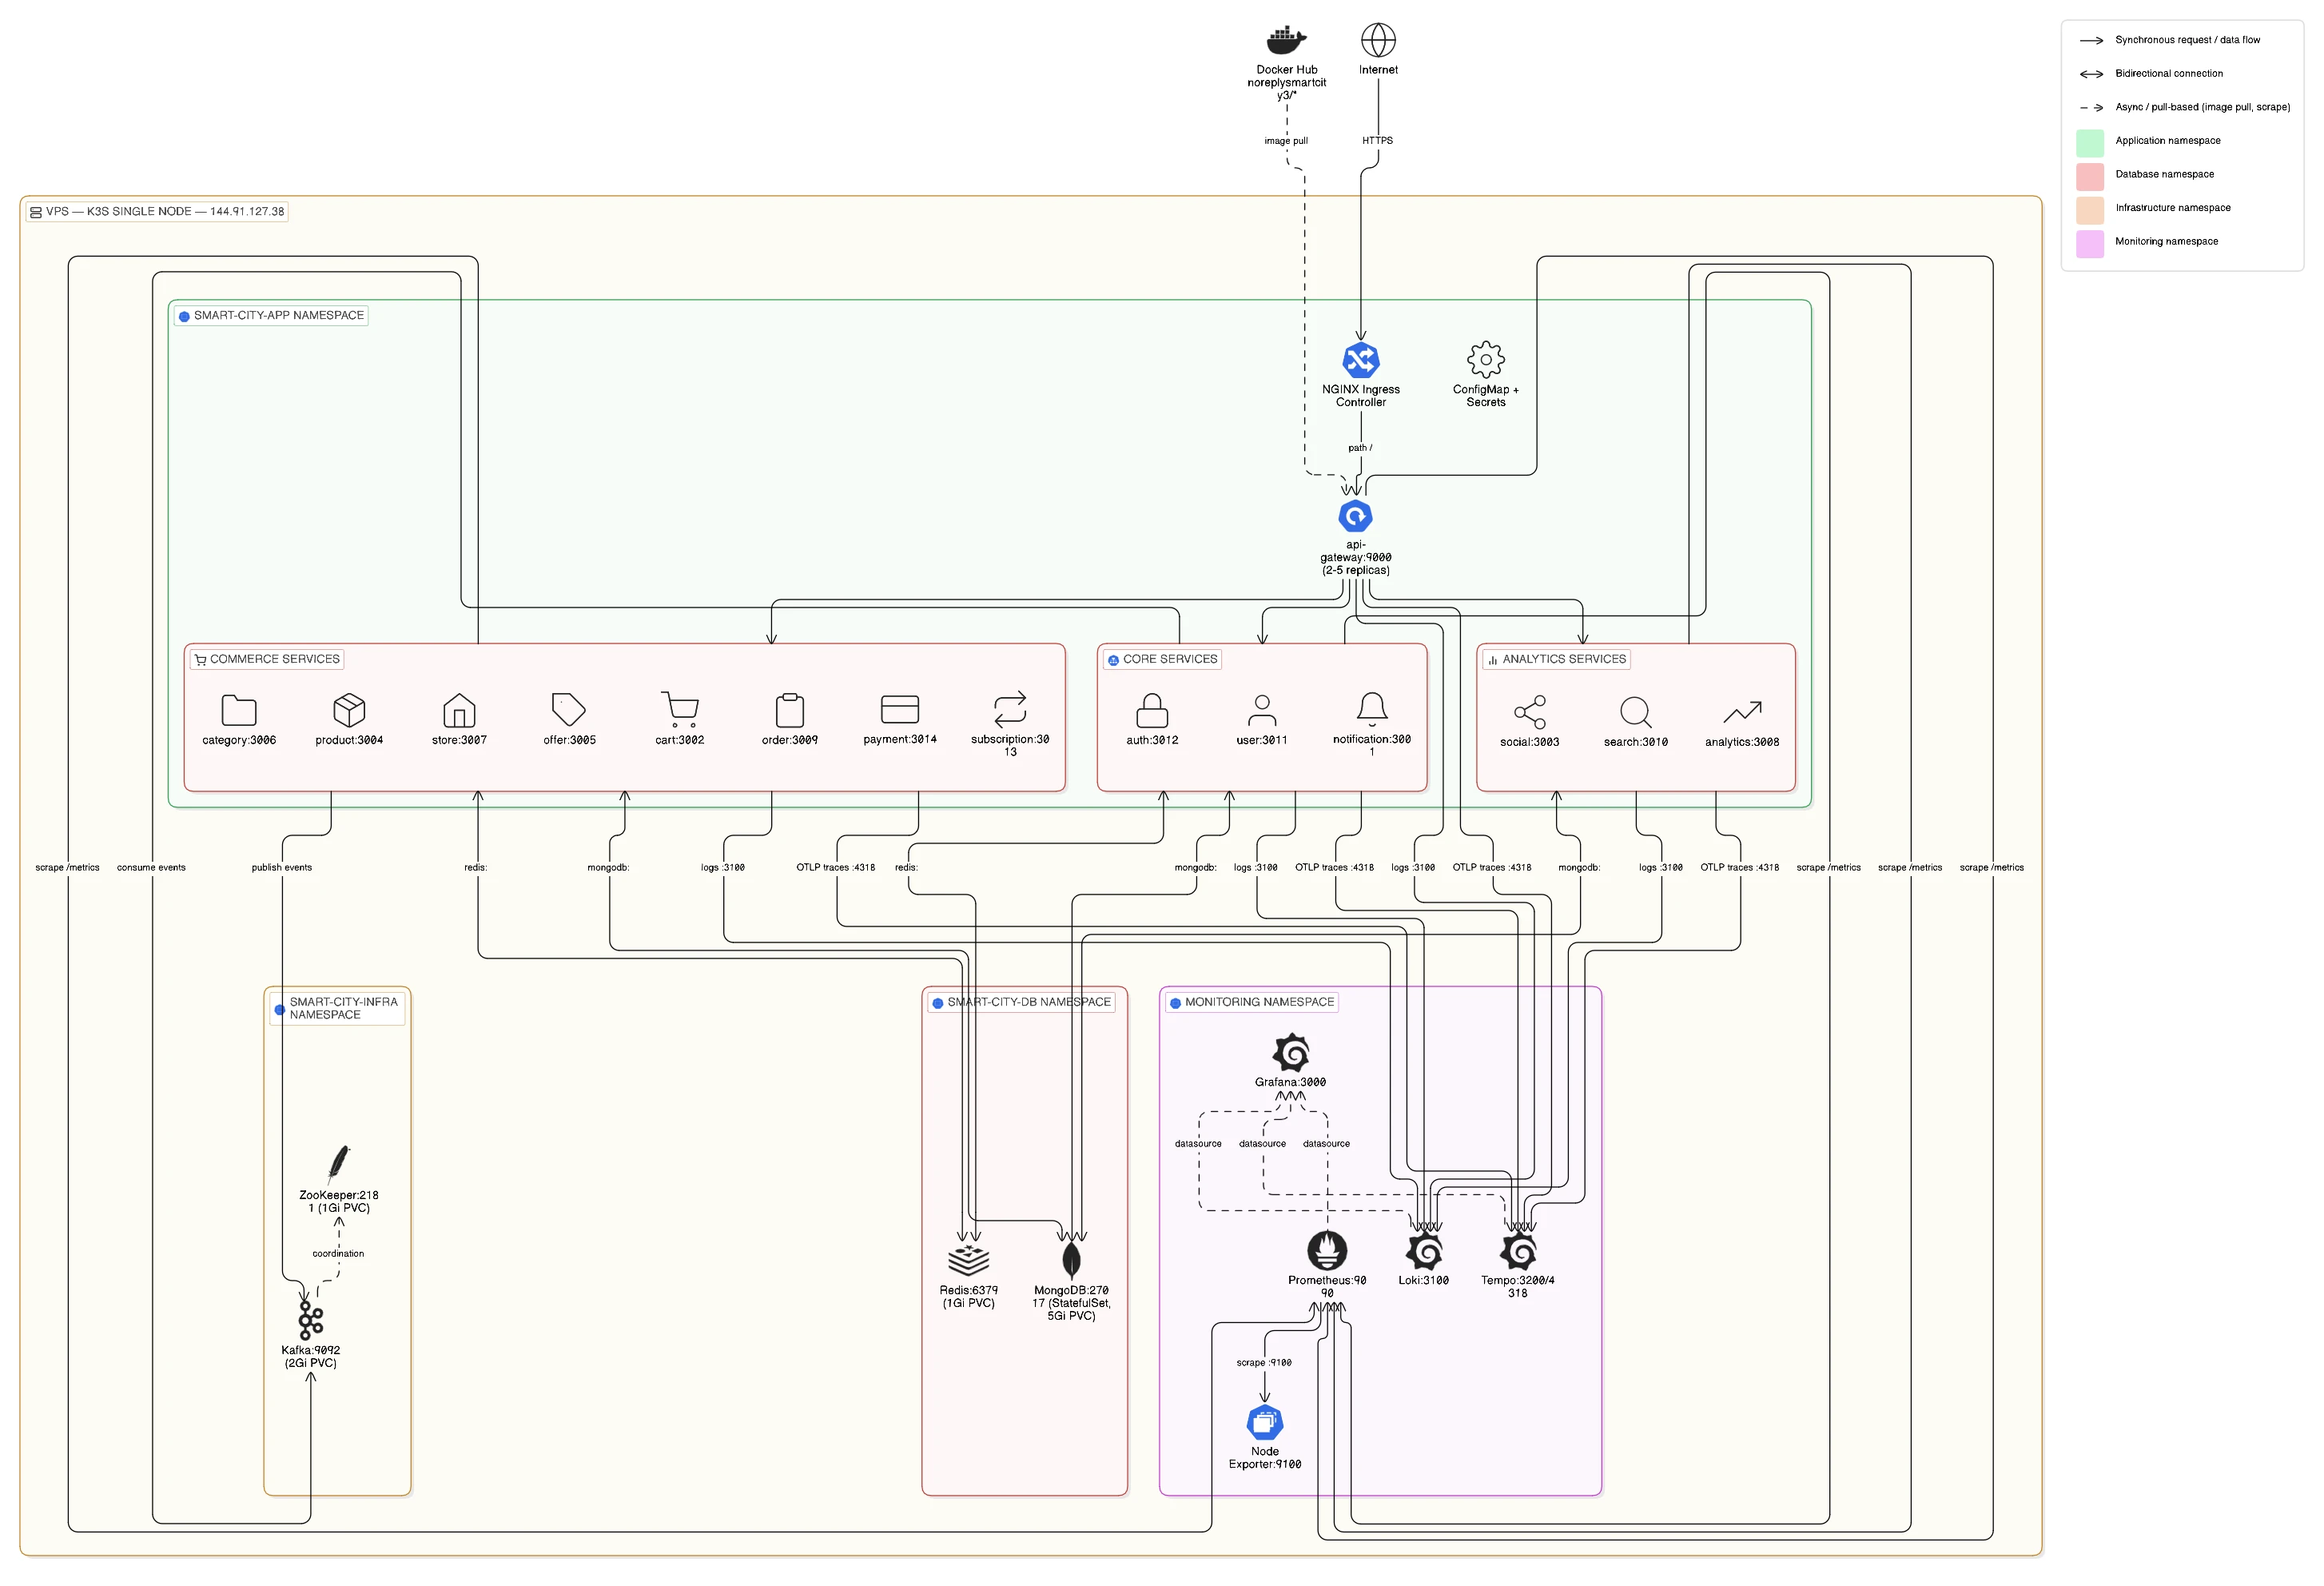 Figure 12: production, five namespaces on Kubernetes.
Neither server was ever set up by hand. Ansible describes the whole machine as code, so one command turns a blank Ubuntu server into a running Kubernetes node. If a server is lost, I rebuild it by running that command again, instead of manually doing the things, isn’t DevOps about automating things ;).
My favourite part is how the two environments stay in sync. In development, the containers are reachable at the same network names they use in production. So the gateway’s routing configuration is identical in both, and the application code has no “if we are in production” branch anywhere in it.
Making it observable
This is the part I enjoyed most, and it is exactly what the operational audit highlighted. All 15 services report data across the three pillars of observability: traces (the path one request takes across services), logs (what a service wrote at a given moment), and metrics (numbers measured over time). On their own they are three separate tools. Together, they let you answer “why was this request slow?” in a single click.
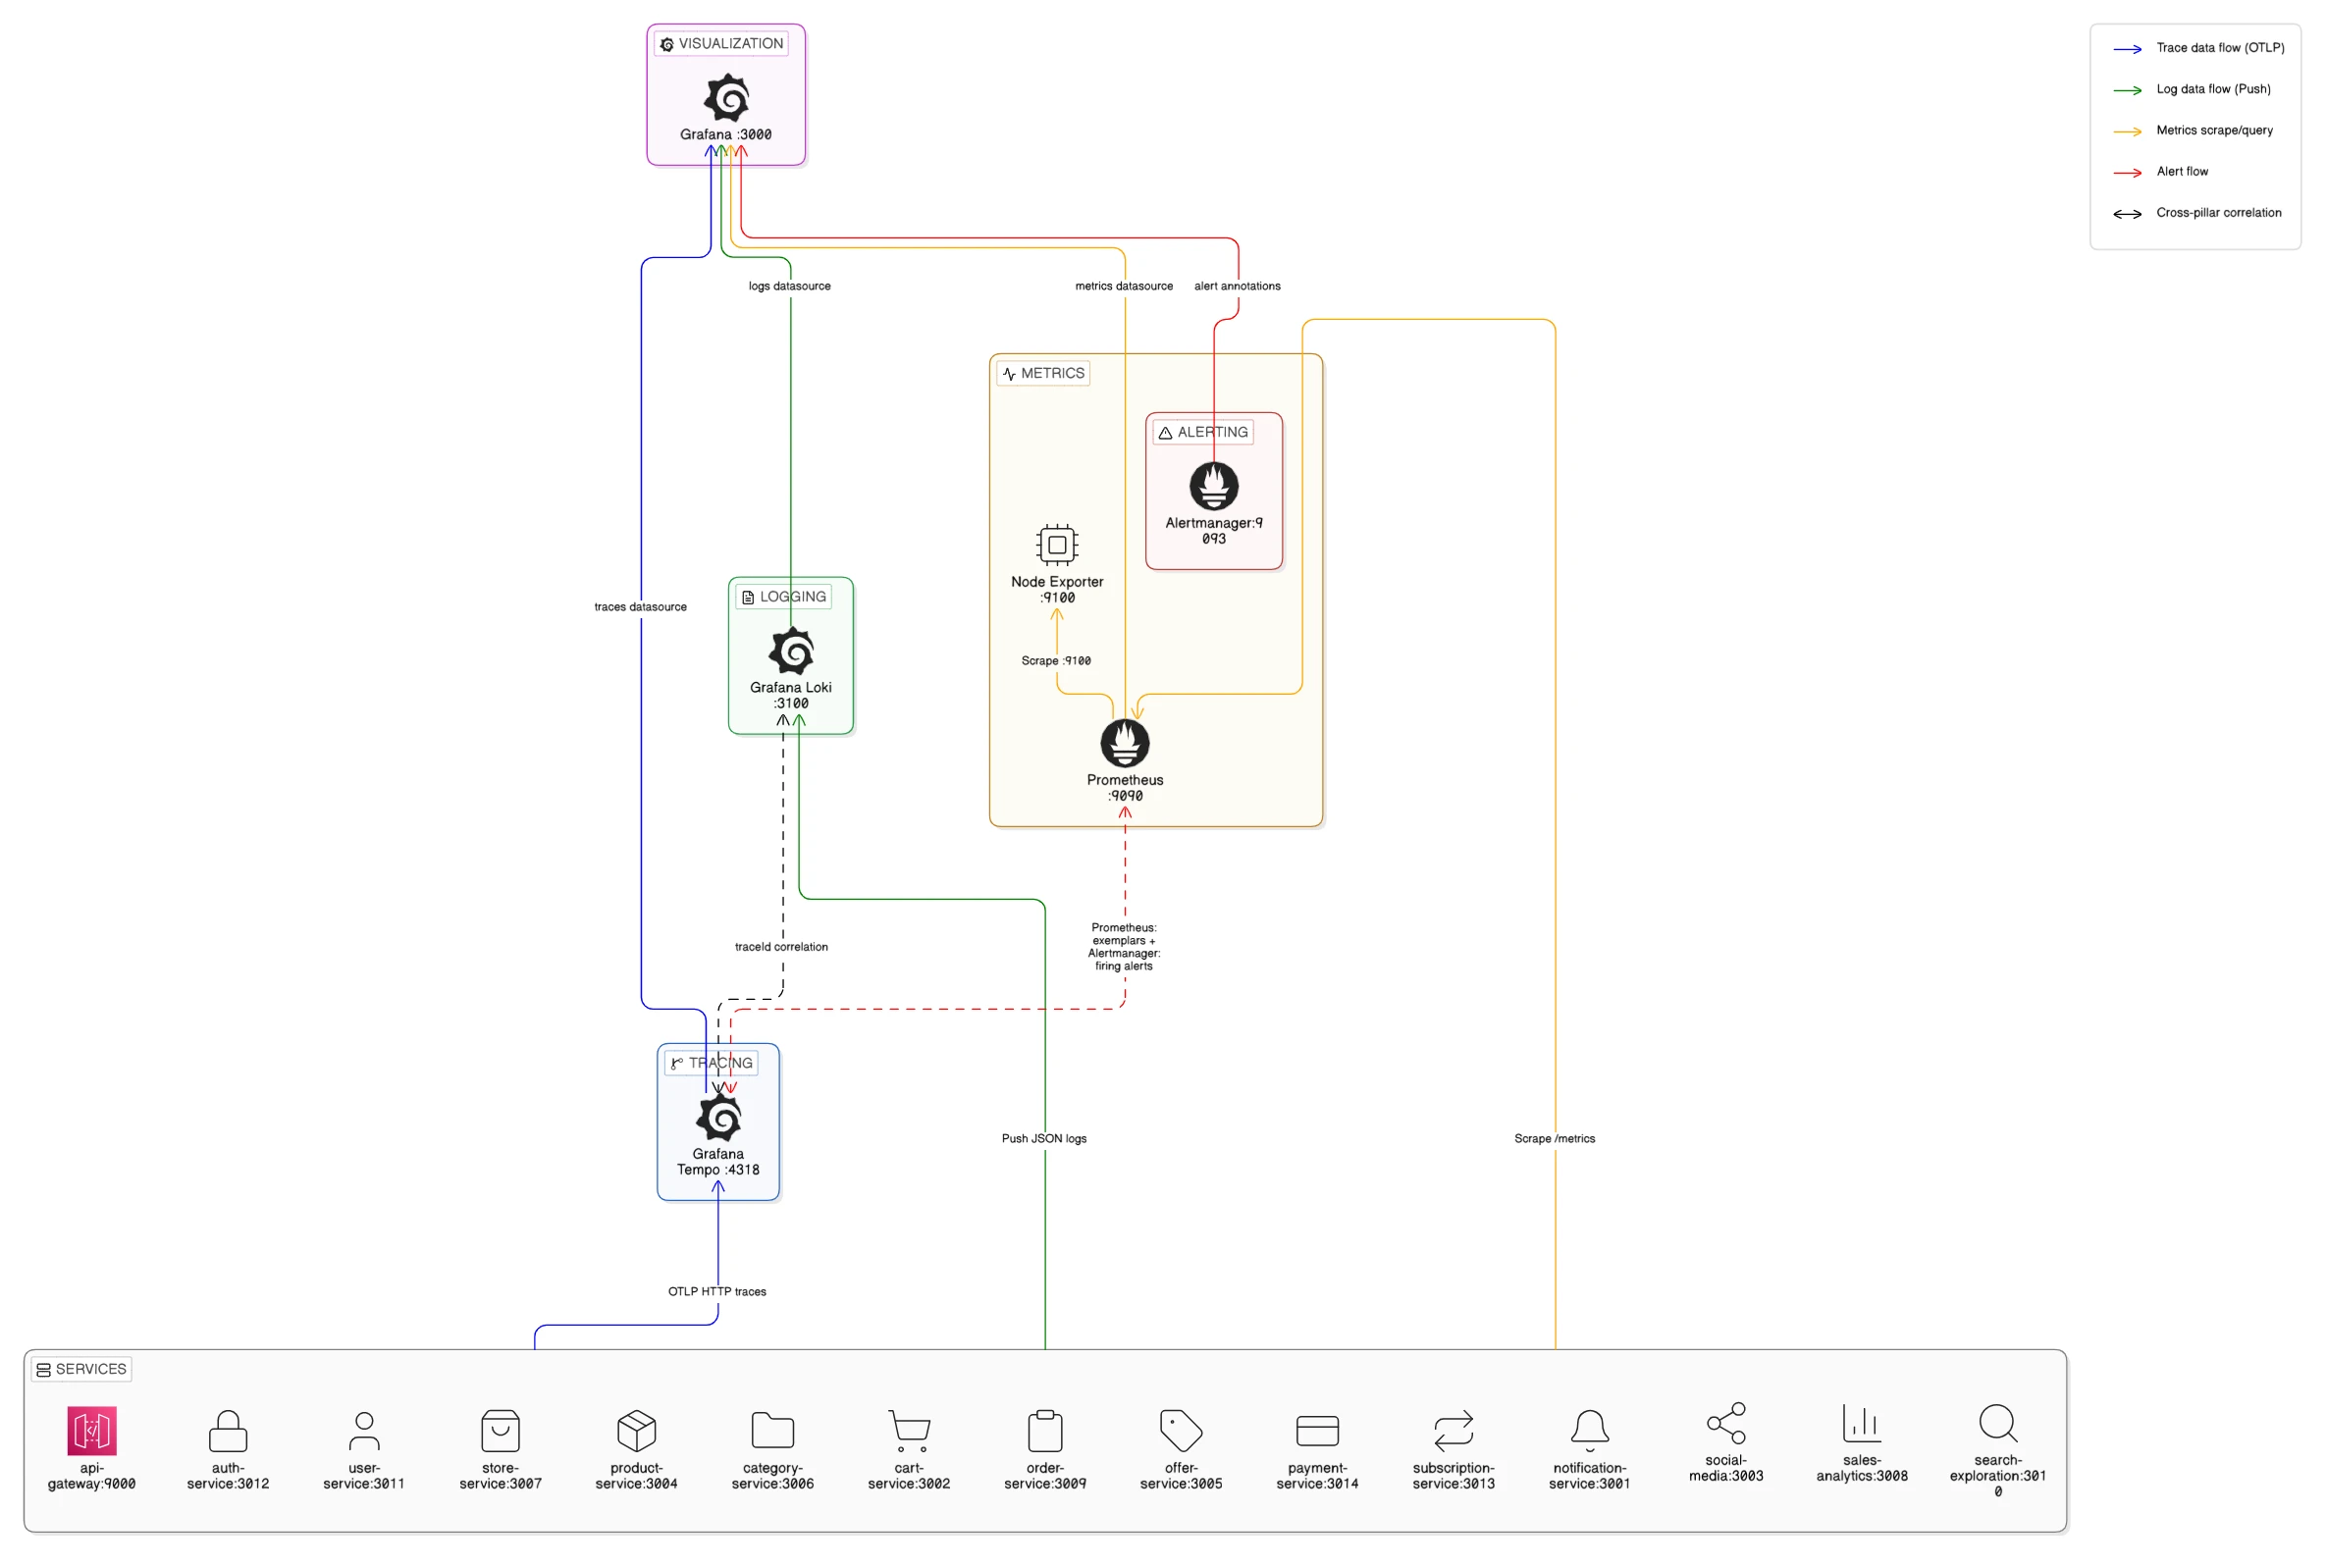 Figure 13: the three pillars under one Grafana.
Traces follow a request even across the event bus. Every log line carries the id of its trace, so one click takes you from a log line to the whole request. Metrics feed dashboards that are generated automatically. The one I open first puts all 15 Node.js services on a single pane, each showing its own CPU and resident memory. At a glance, every card is green.
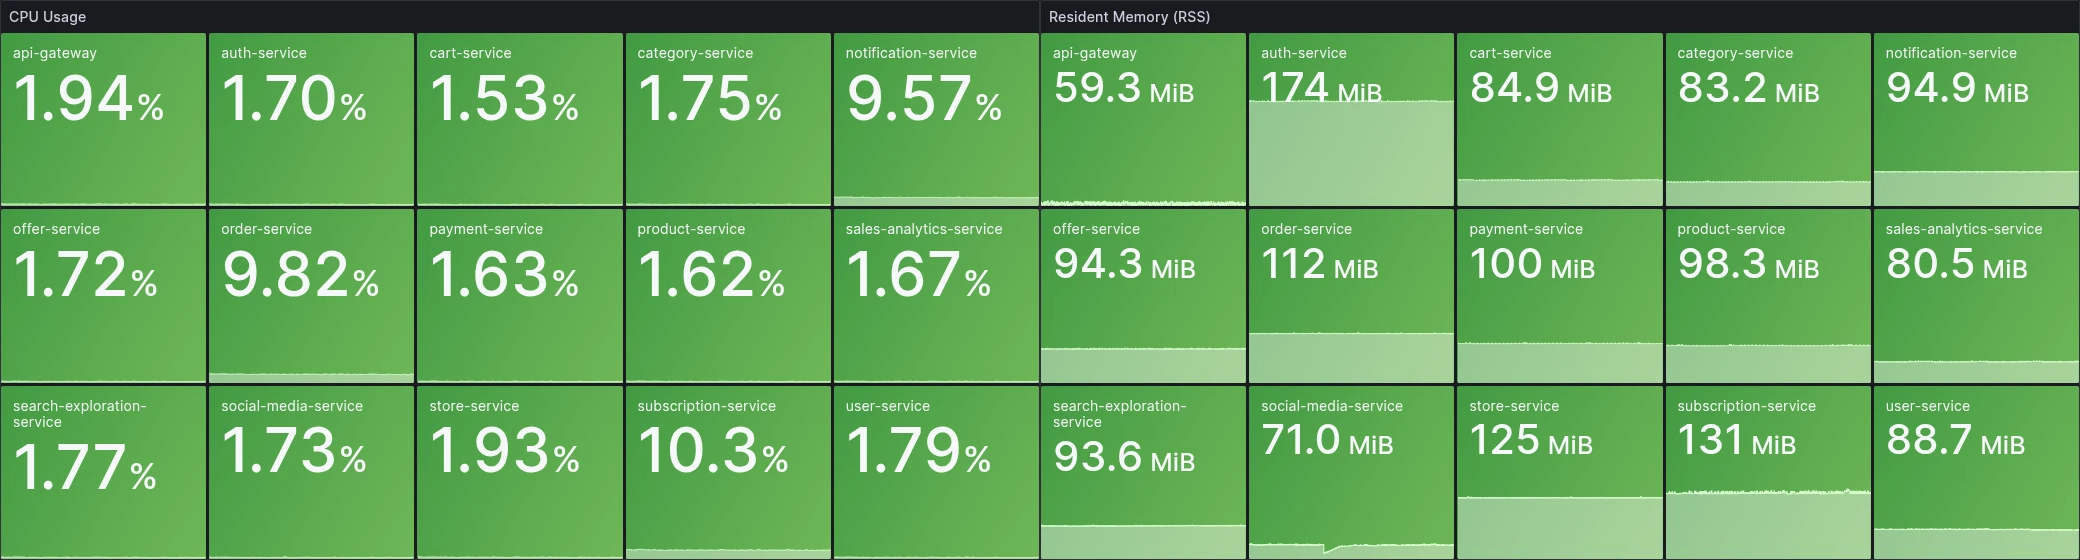 Figure 14: every service’s CPU and memory at a glance, all green.
The full dashboard goes deeper on the three signals that actually tell you a Node.js service is healthy: CPU, memory, and the event loop. Resident memory stays flat across the whole window, the clearest sign that nothing is leaking, and the event-loop lag never builds up, so no service is quietly falling behind.
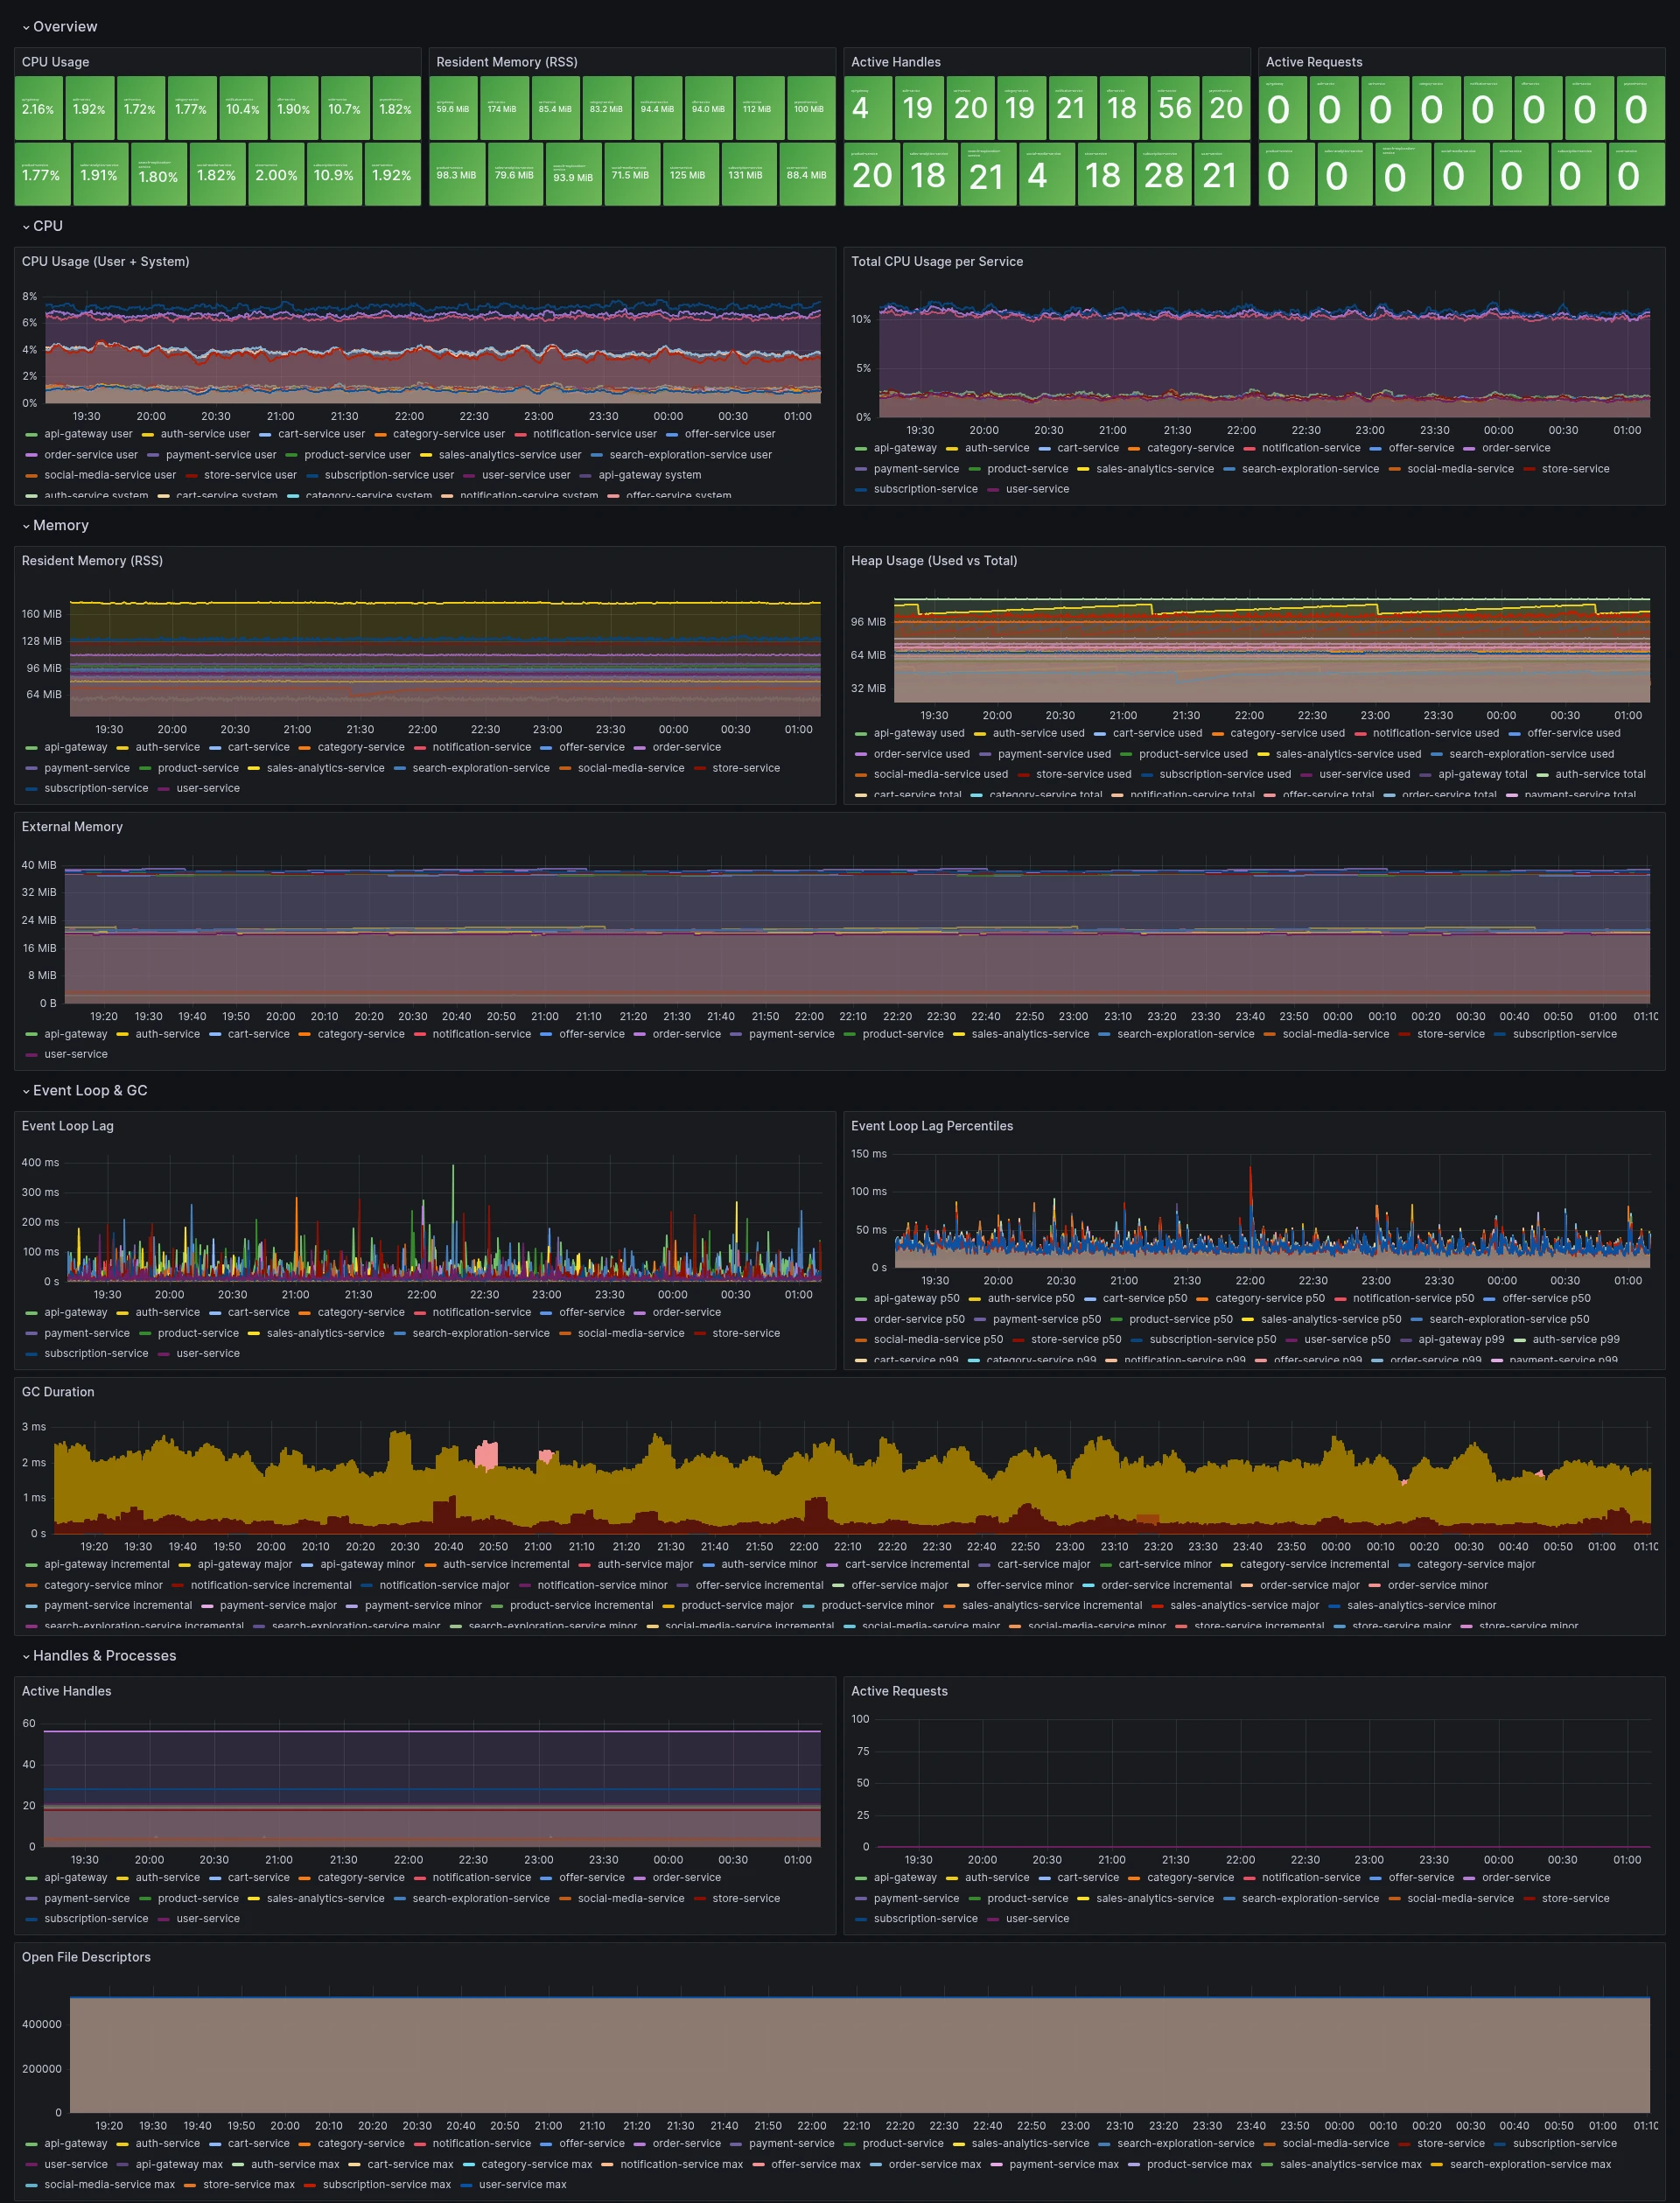 Figure 15: the full per-service dashboard, CPU, memory, event loop and GC across all 15 services.
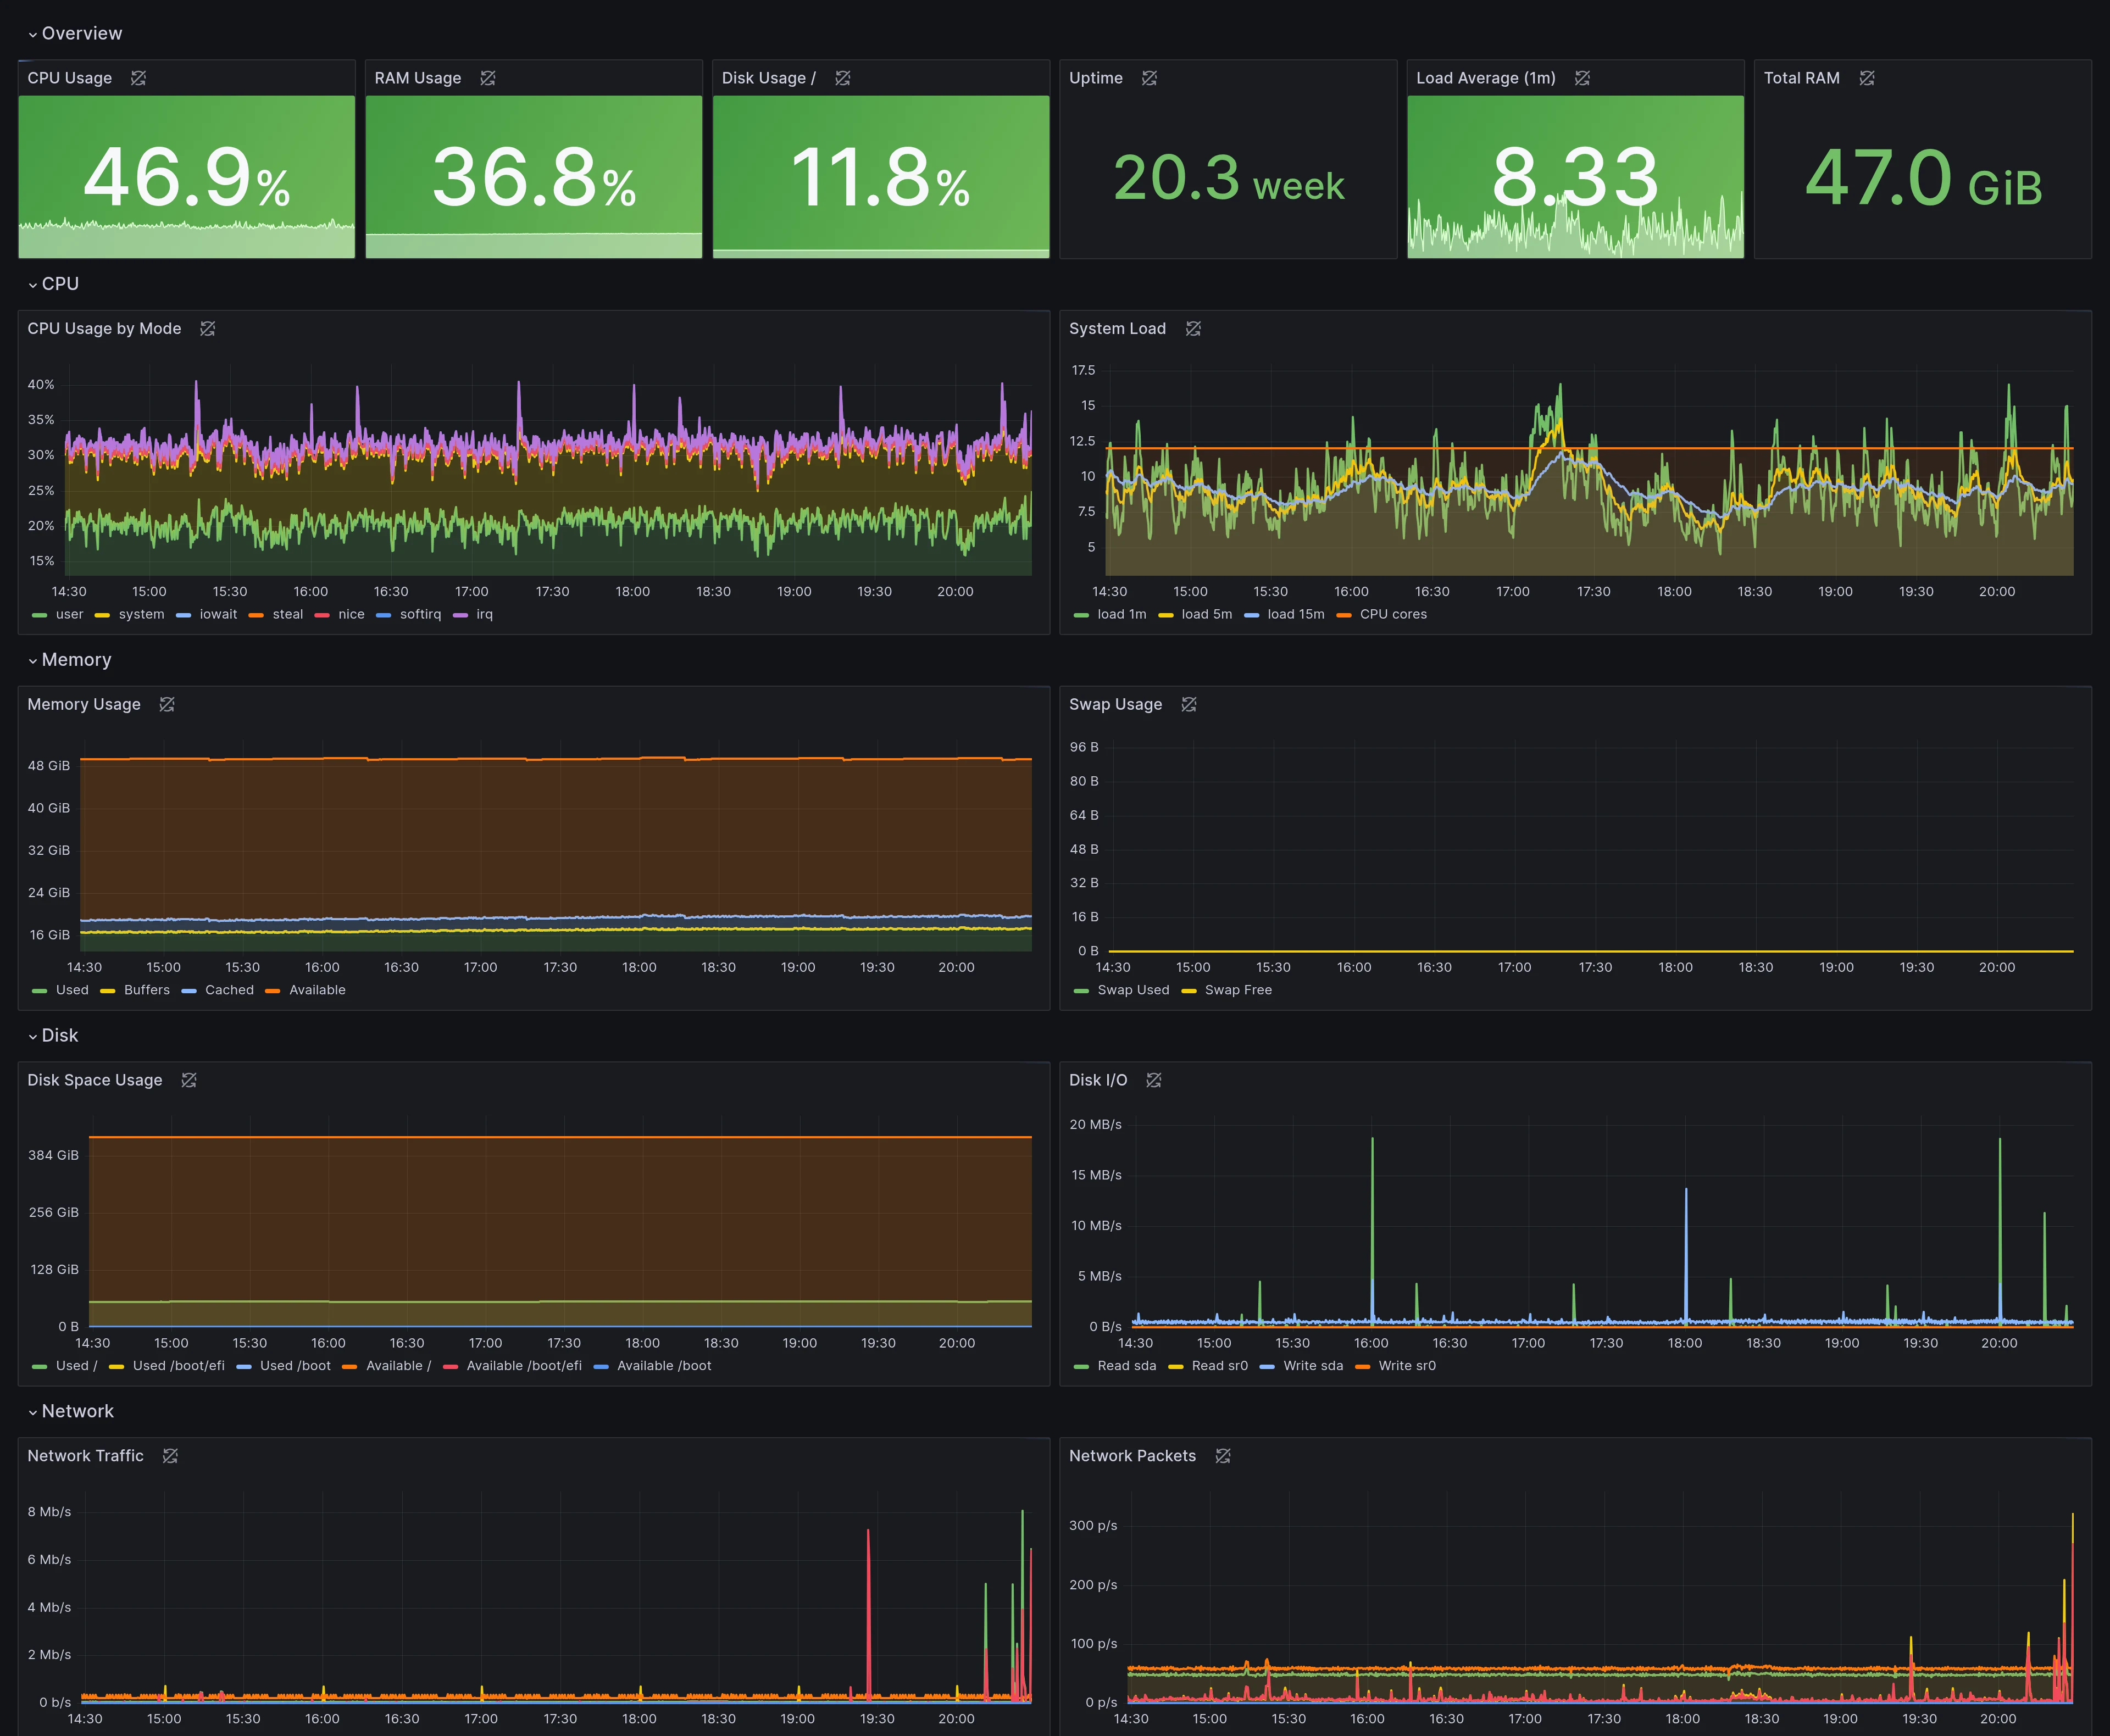 Figure 16: the production server, 20 weeks of uptime.
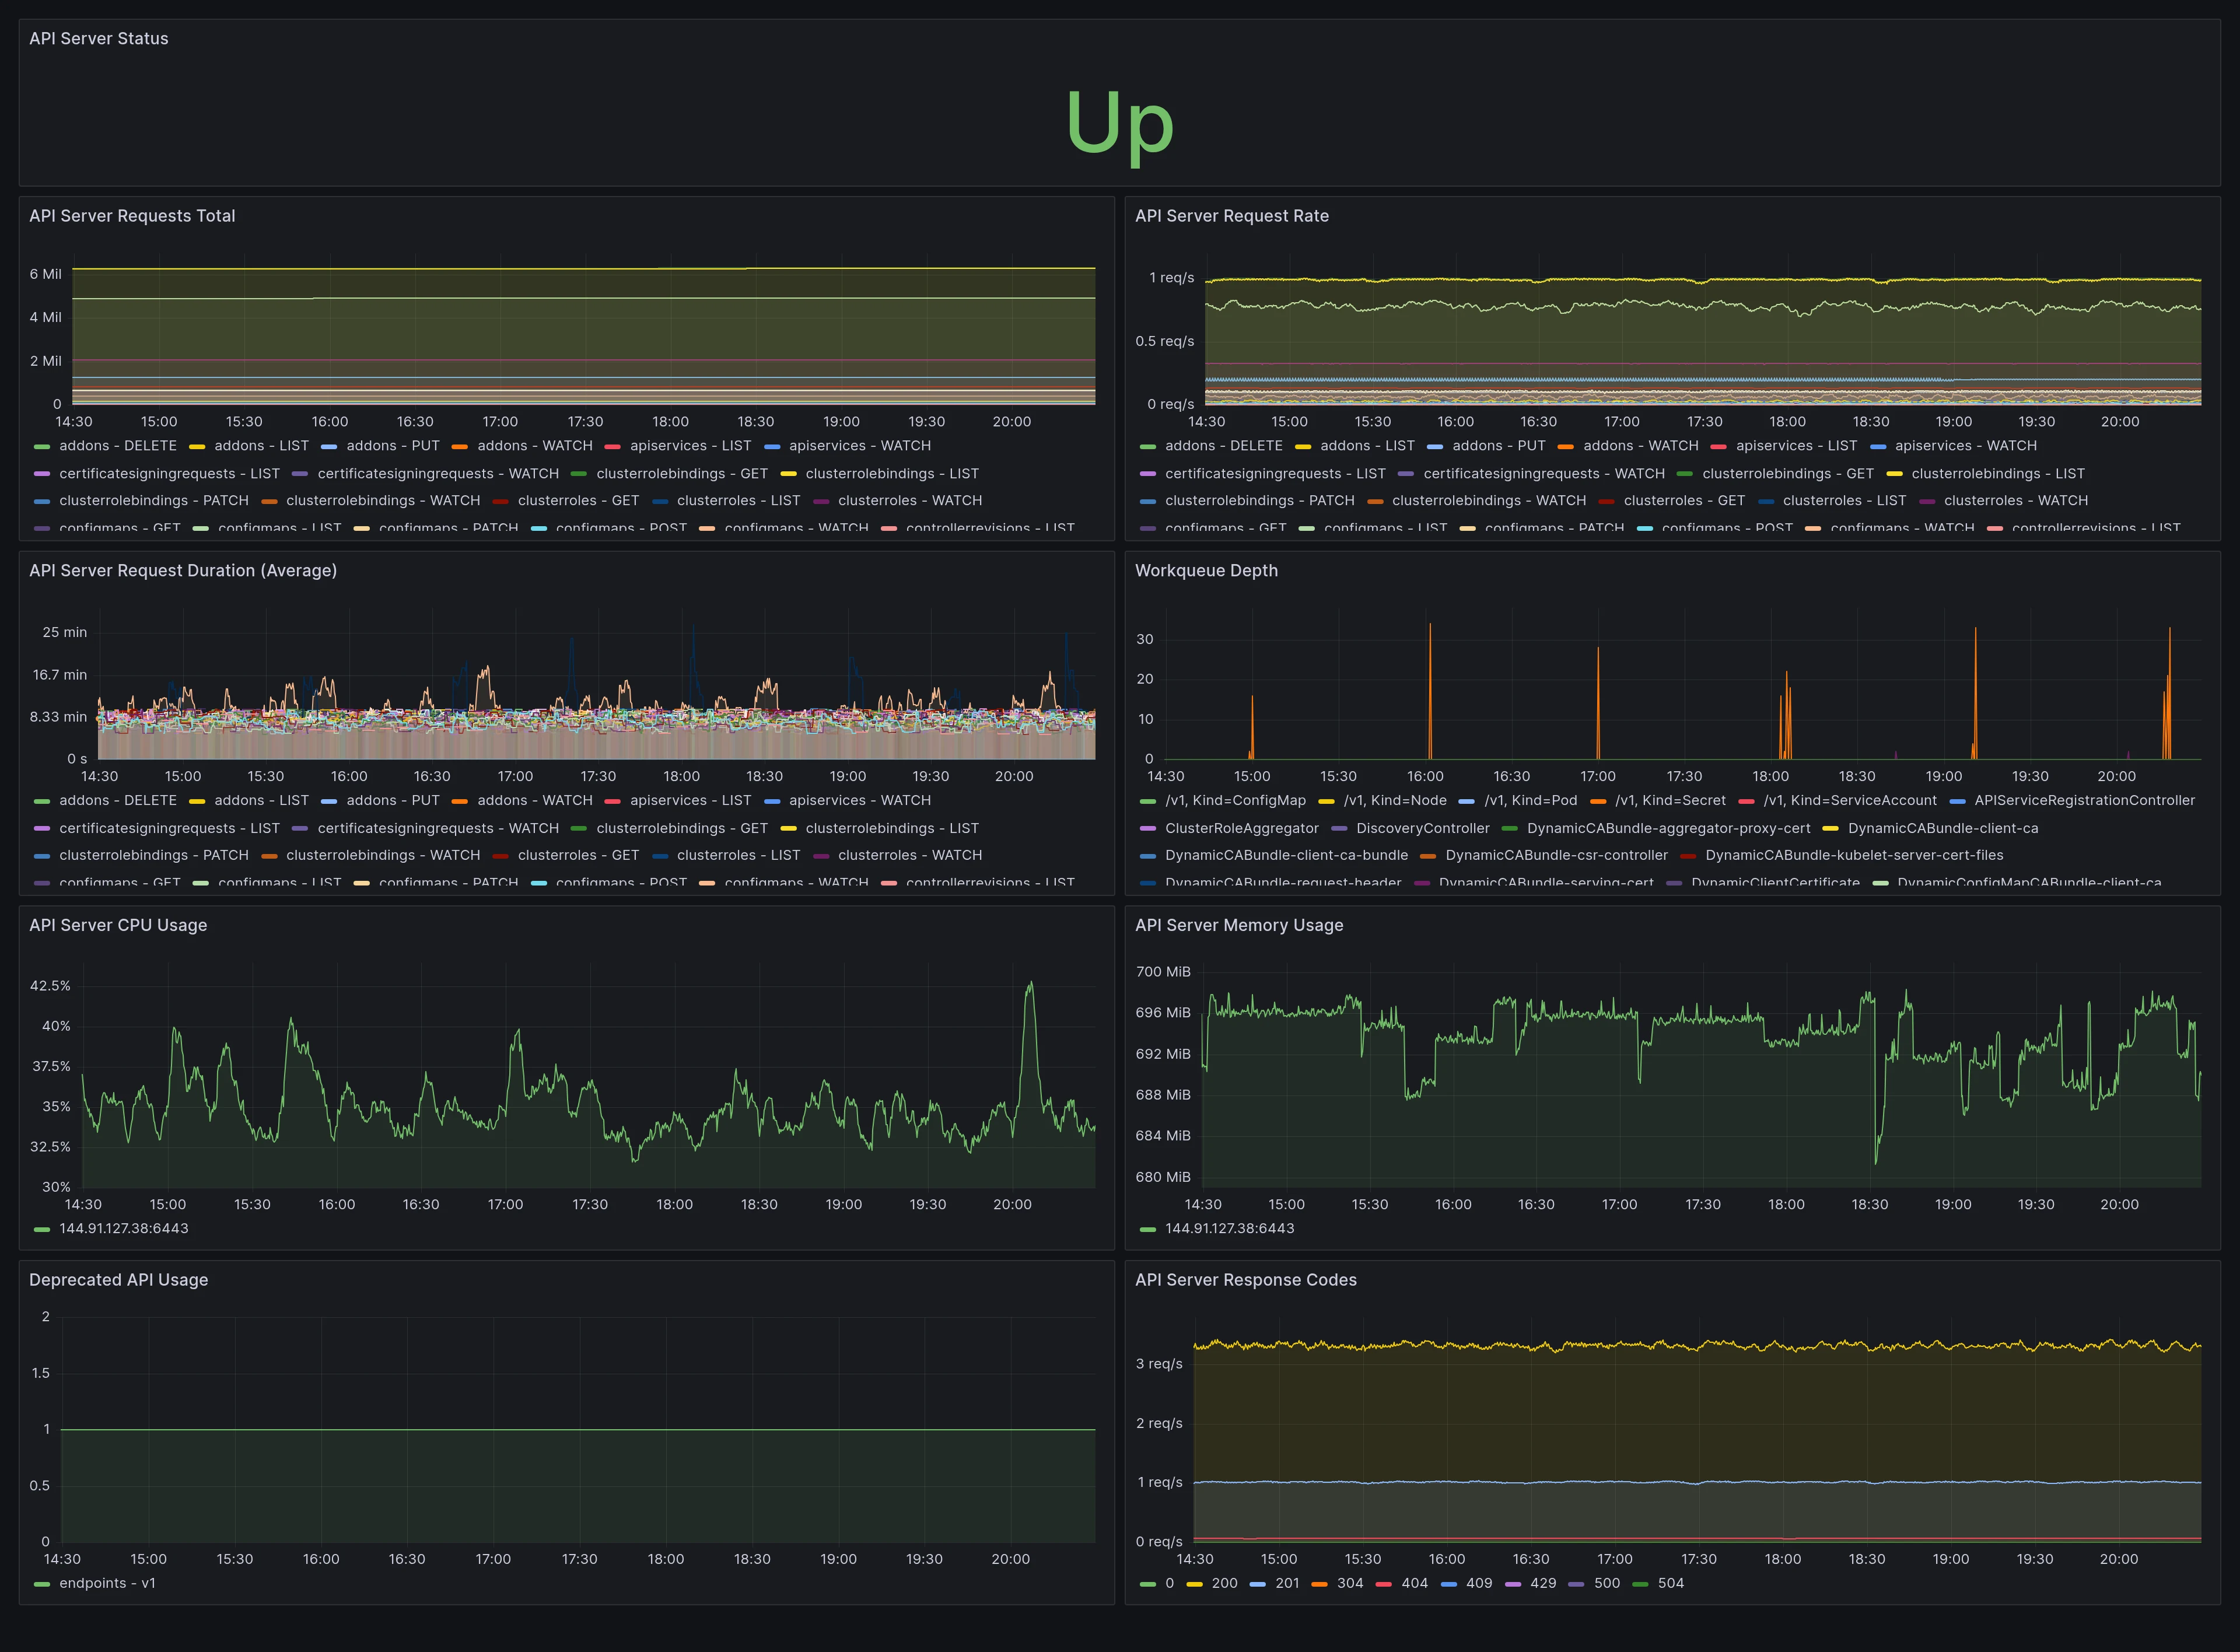 Figure 17: the Kubernetes control plane watching itself.
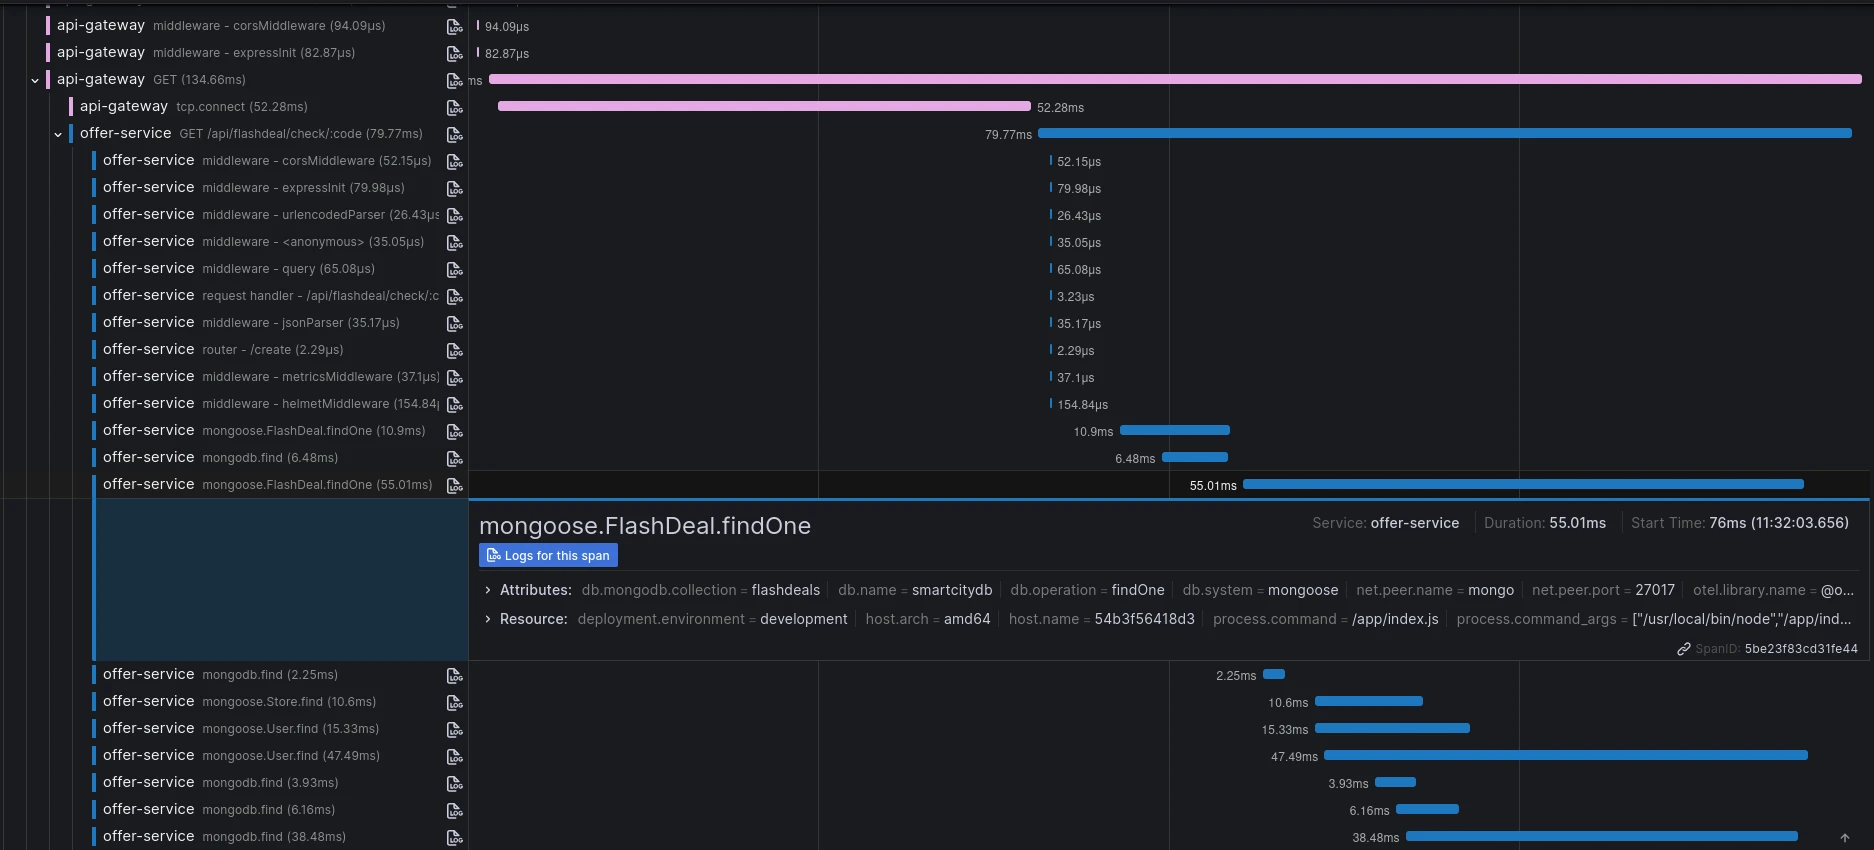 Figure 18: one request as a trace waterfall.
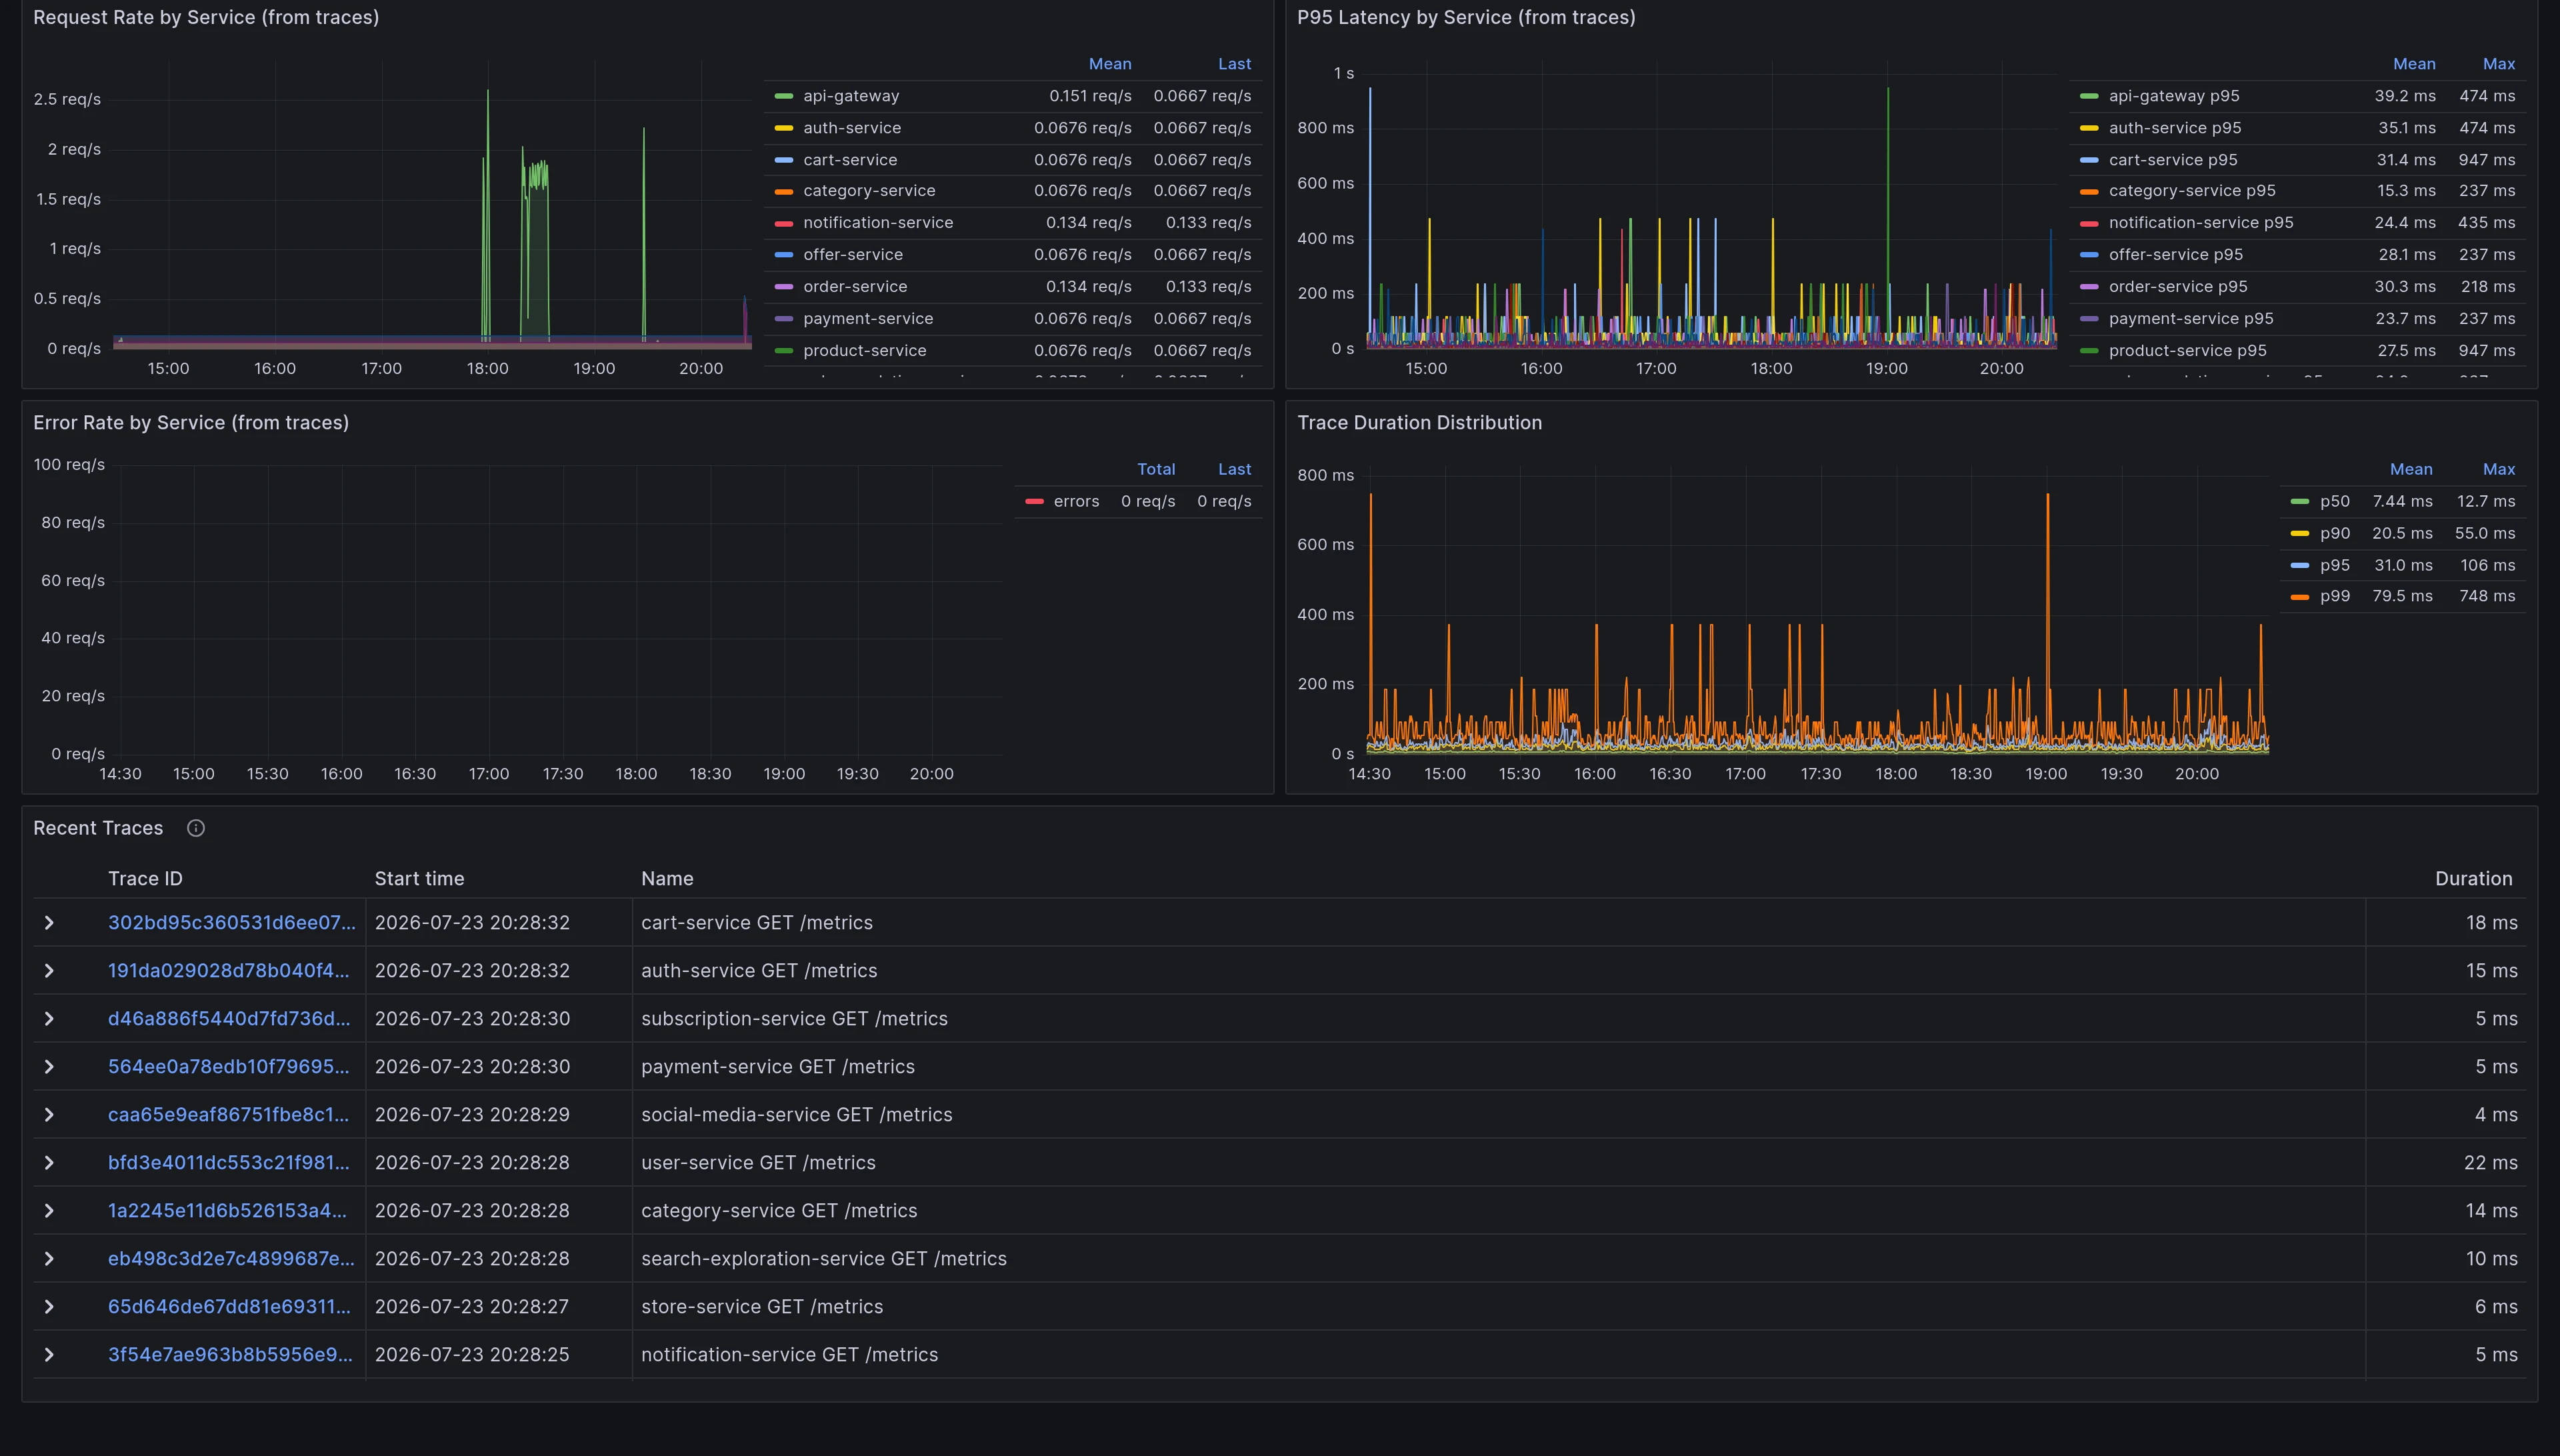 Figure 19: the traces explorer, rates and p95 from spans.
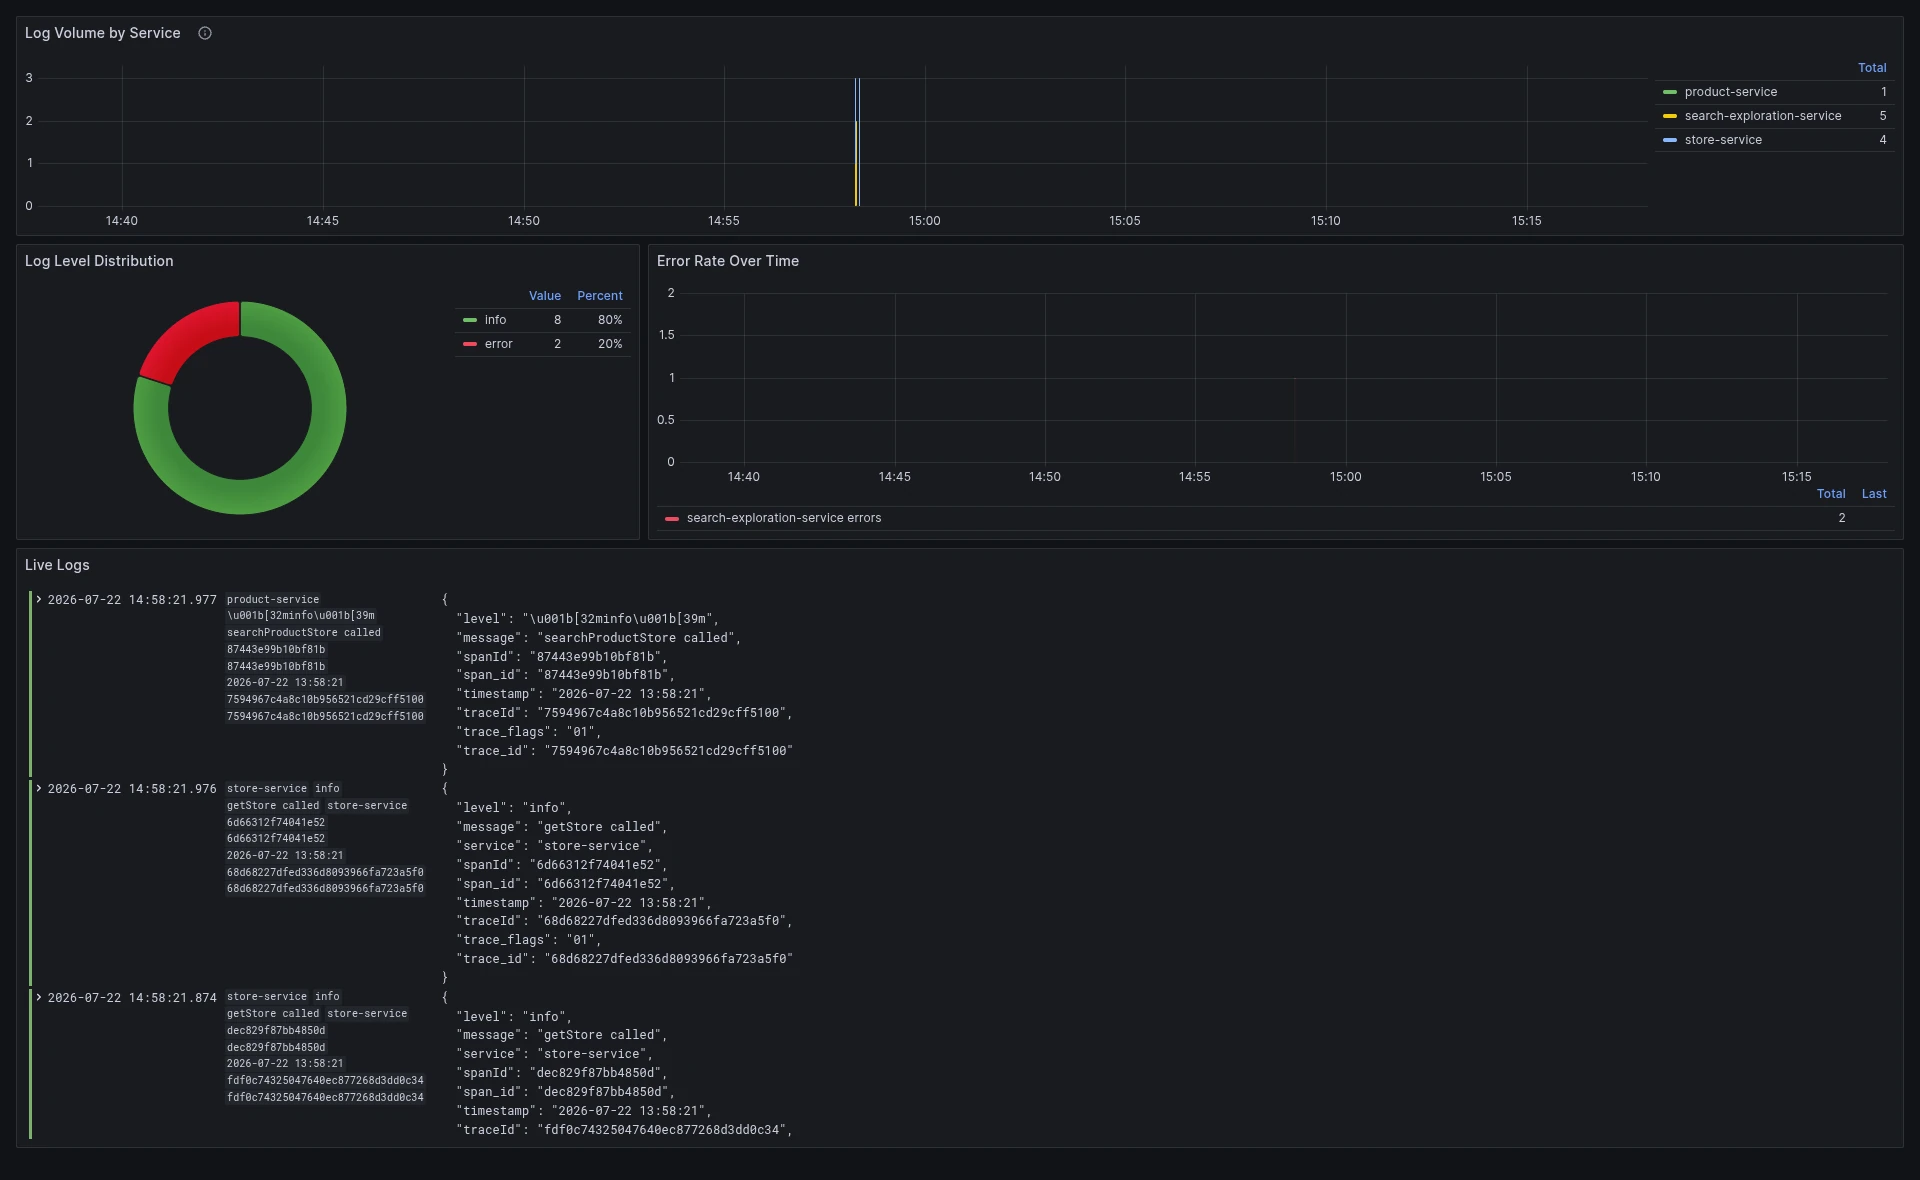 Figure 20: the logs explorer, structured app logs with the trace id on every line.
The dashboards also have 29 alert rules, ranked by priority: problems users notice first, then infrastructure, and last the monitoring system checking itself, so a broken monitor still reports its own failure. Each rule must stay true for a set time before it fires, so a one-second spike never triggers an alert, and one outage produces one alert, not fifteen.
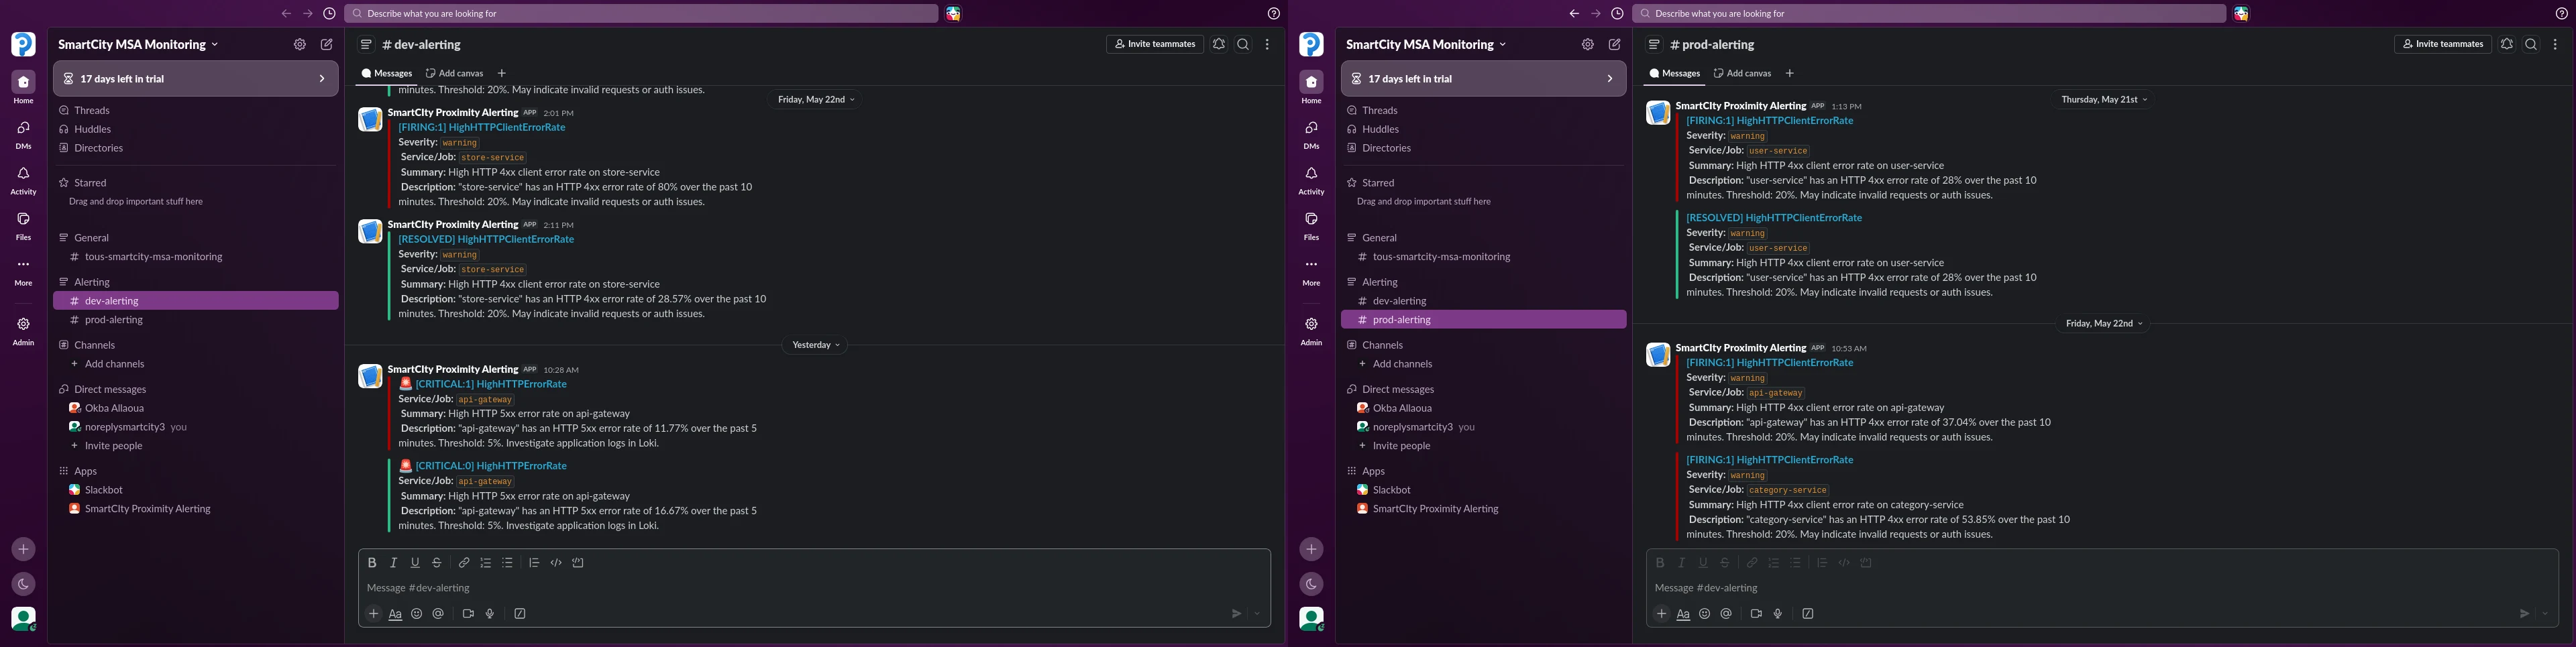 Figure 21: the alert pipeline, dev left, prod right.
Does it hold up
To validate the platform I ran what’s called load and performance testing: which basically means running simulated Virtual Users that send requests to push the system to the limit under heavy traffic in different types, where we used (load, spike and soak testing). Each run walked through real client and seller journeys, from signup to checkout. In production, the load phase served about 17,700 requests with a 95th-percentile response time of 102 milliseconds, and the soak run finished with no memory growth and no slowdown over time. Every threshold passed on both environments.
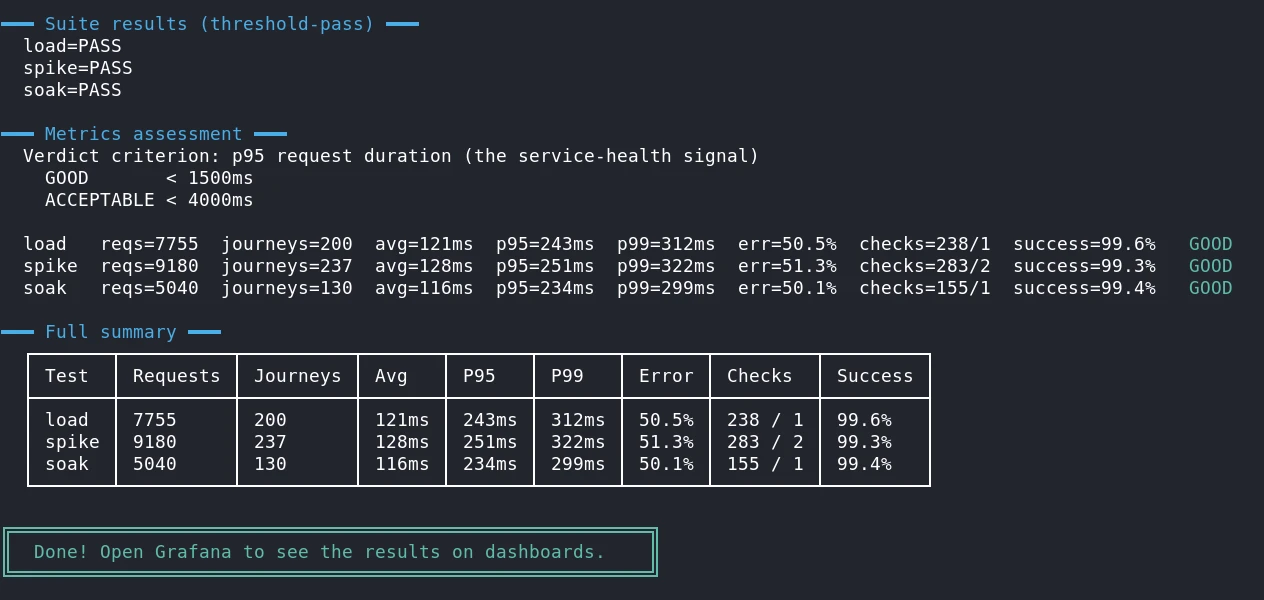 Figure 22: load, spike, and soak on development.
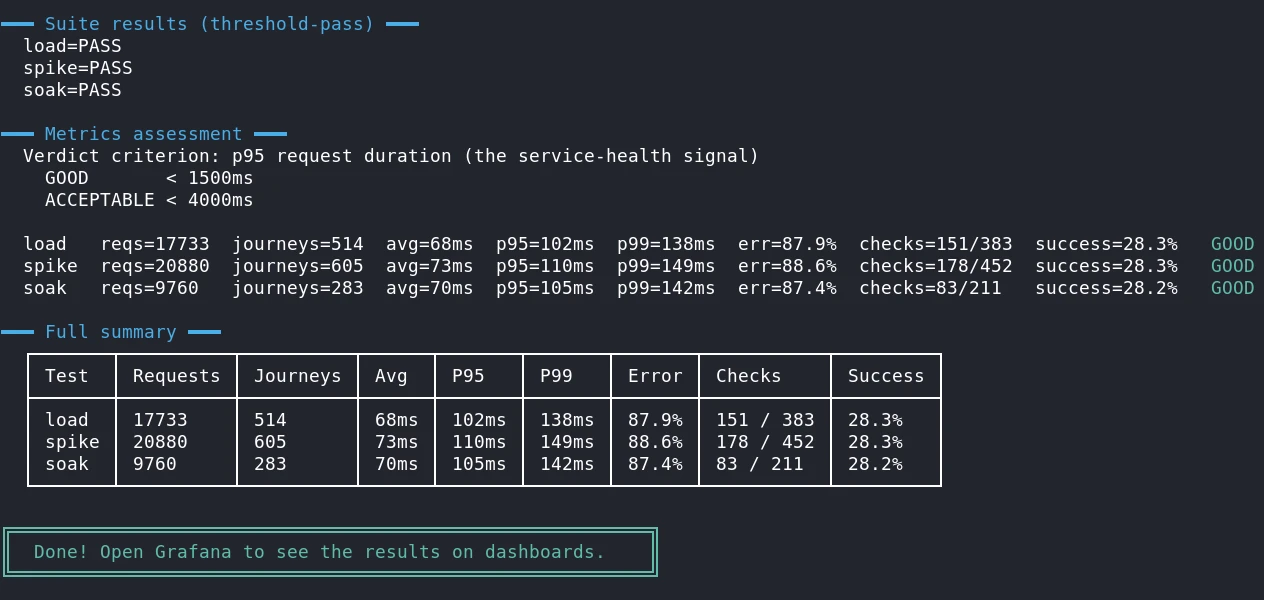 Figure 23: the same three on production, p95 102ms.
The server dashboards tell the same story from the infrastructure side. While the load generator hammered the system, CPU, memory and load average on both machines rose, held steady, and settled back, with no runaway growth on either. The smaller development box, running the full stack on 6 vCPUs and 12 GB, worked the hardest and still stayed comfortable, while production, on 12 vCPUs and 48 GB, barely noticed the traffic.
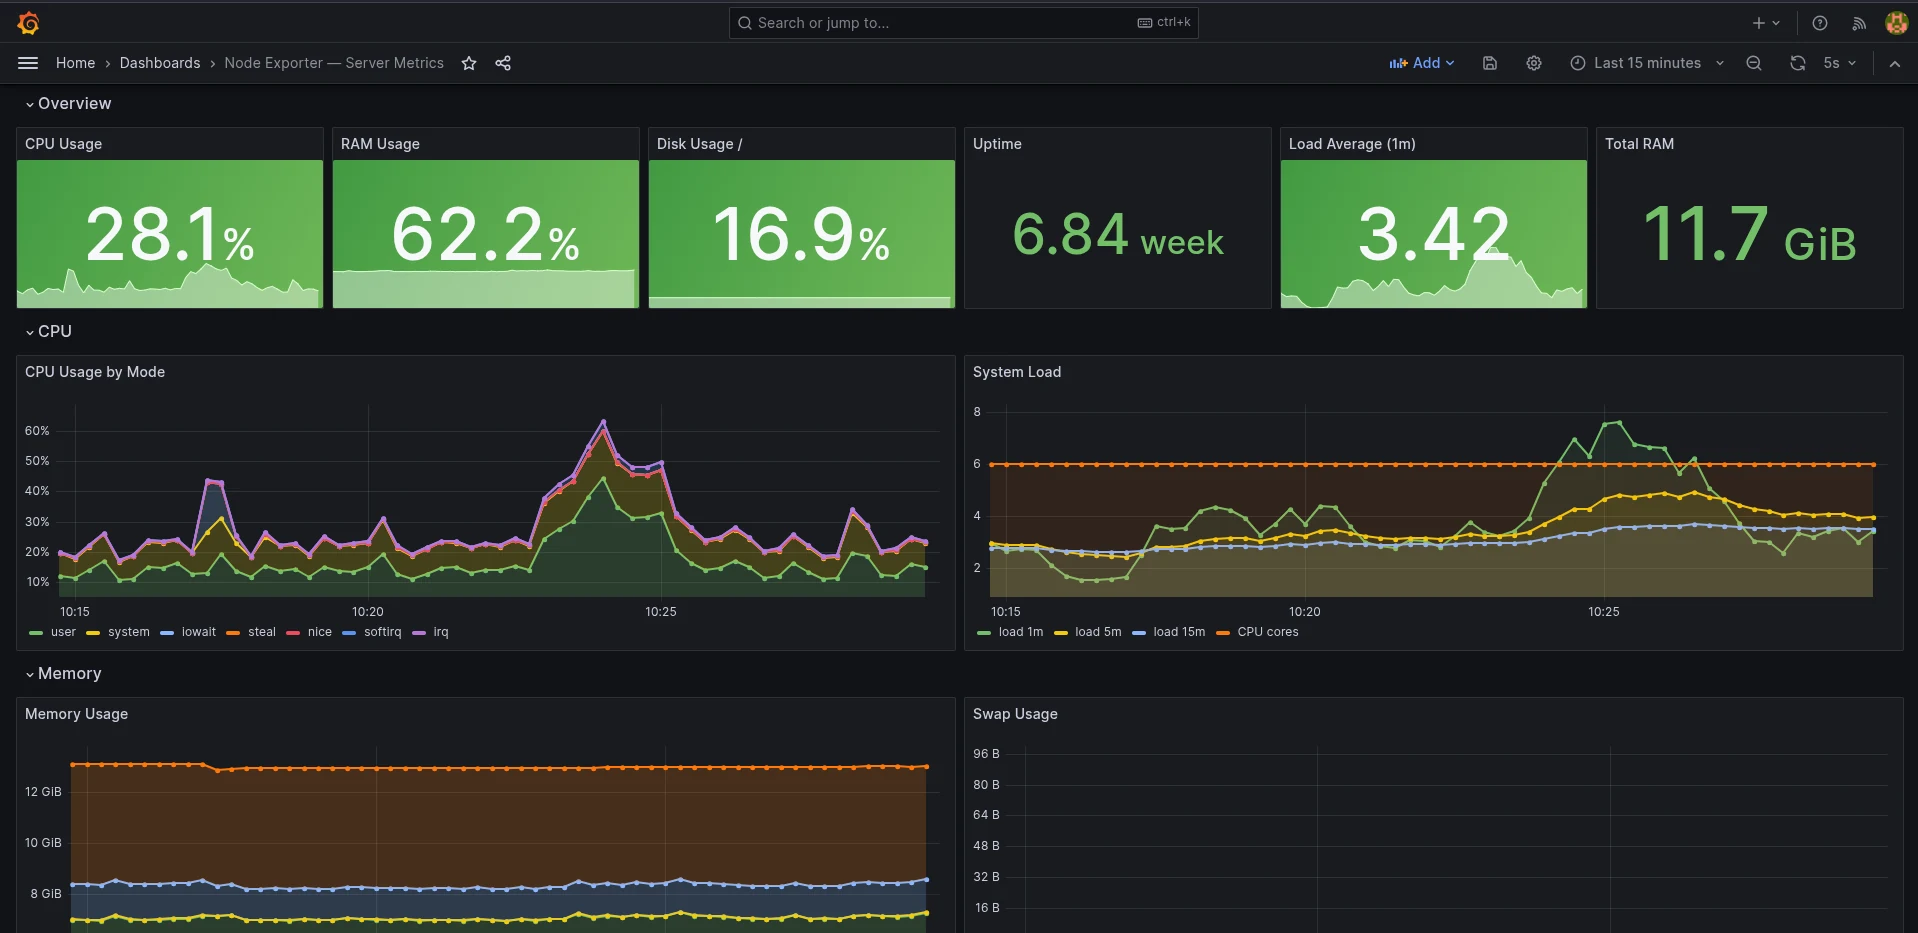 Figure 24: the development server holding steady under load.
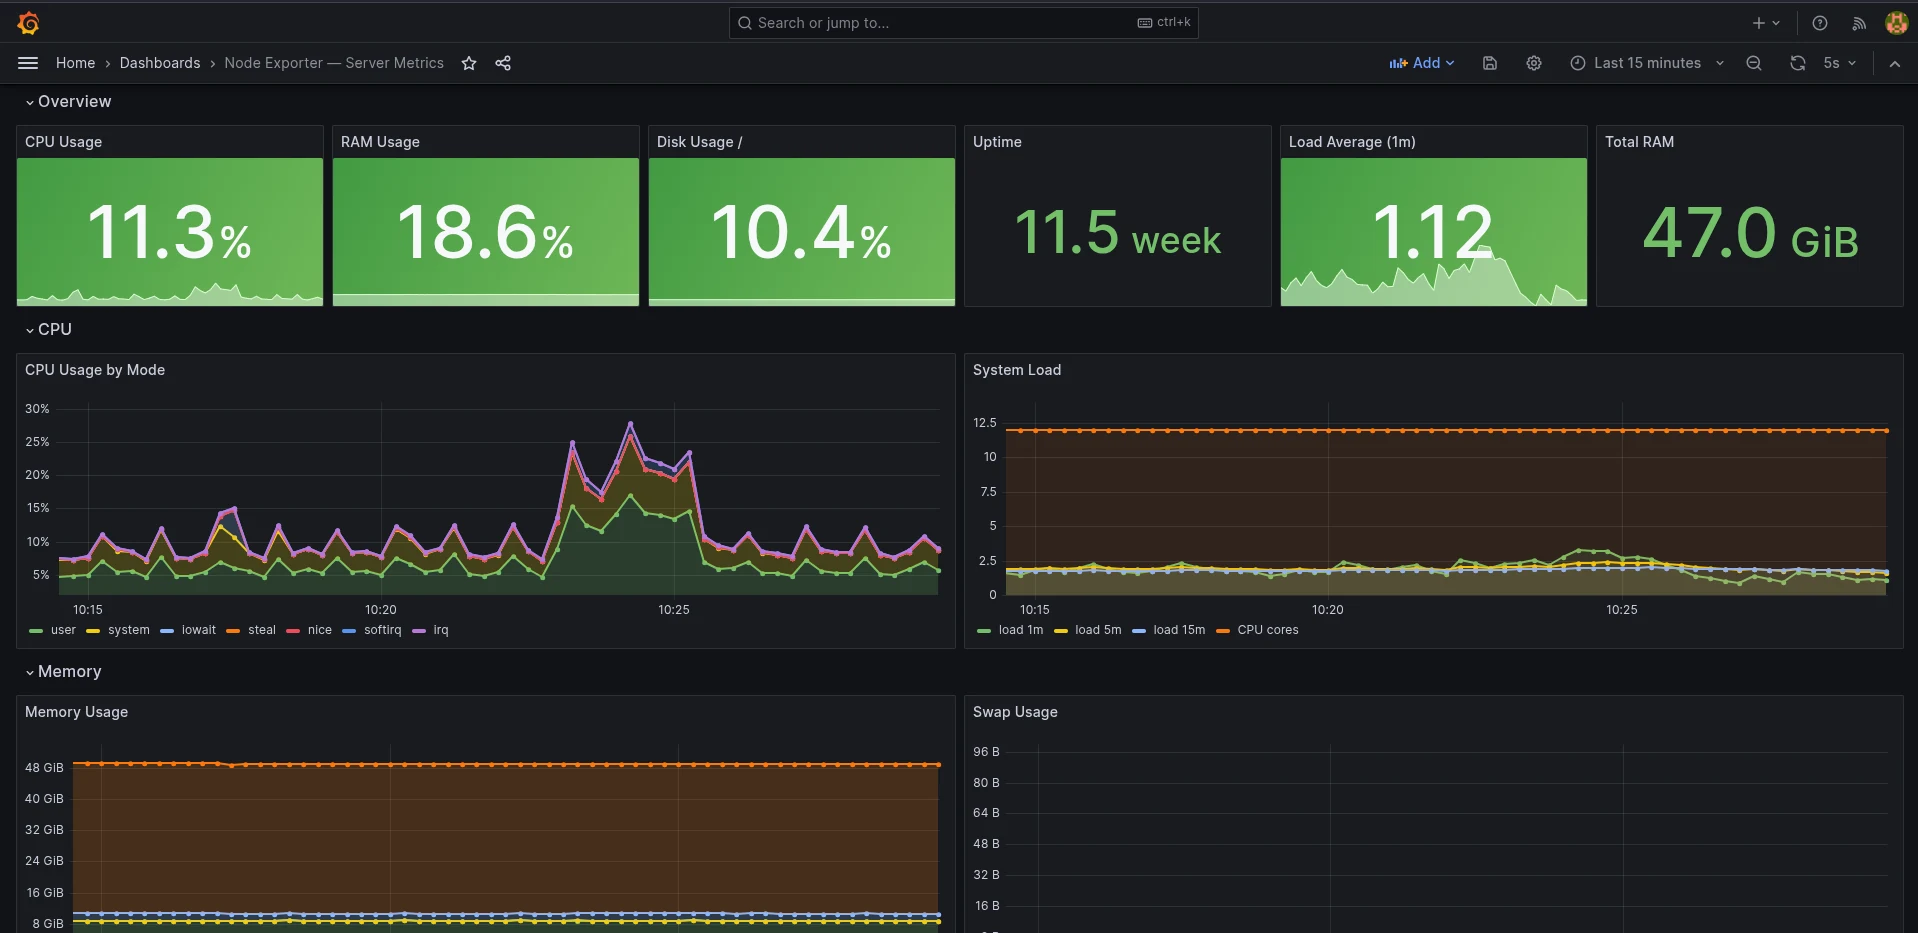 Figure 25: the production server barely moving under the same load.
The results
Every Must-Have in the specification was delivered. One Should-Have was dropped to make time for the operational work. Nine months, in one table:
| Metric | At handoff | At delivery |
|---|---|---|
| Security vulnerabilities | 25 | 0 |
| Schema mismatches losing data silently | 18 | 0 |
| Copies of the shared login code | 13 diverging copies | 1 shared auth package |
| Automated tests | 0 | 3,618 |
| Average statement coverage | 0% | 94.5% |
| ISO/IEC 25010 rating in SonarQube | E on every service but the gateway | A across all 15 |
| Quality gate in CI | none | blocking on every repo |
| Average latency, 13 heaviest DB queries | 9.95 s | 460 ms |
| Production latency under load (p95) | never measured | 102 ms over ~17,700 requests |
| Deployment | from a laptop | Ansible-provisioned Kubernetes, zero-downtime rollouts |
| Observability | none | traces, logs, metrics, 29 alert rules |
| Production node uptime | none | 20 unbroken weeks |
What I learned
The most important decision came at the very start. I could have treated the inherited platform as a dead end, rebuilt every service from scratch, and presented the result as entirely my own work. That path is shorter and has fewer moving parts, because code you write yourself is code you trust from the first line.
I chose the harder path: keep the system that already existed and turn it into something production-ready. That is what engineering usually looks like in practice. In an established company you inherit systems that are already running, and the work is to audit them, improve them, and keep them alive, not to rebuild them from zero every time a new requirement appears. Rewriting from scratch is rarely on the table, and rarely the right call.
Proximity let me do exactly that as a DevOps engineer, working across development and operations on a microservices architecture. Once the first build is finished, the real cycle begins and does not stop: audit, evolve, refactor, deploy, and around again.
Conclusion
If this year taught me one thing, it is that an audit is not a box to tick before the real work begins. On a system that is already running, the audit is the real work, and it never truly ends. My supervisor Dr. Seriai summed it up in a line I keep coming back to: building software is roughly 25% of the effort, and the other 75% is keeping it running. It is one of the oldest findings in software engineering, and everything I measured on Proximity confirmed it.
Run the phases in the wrong order and you end up automating the delivery of broken code and monitoring features that do not yet exist. What comes next is already visible in the data the platform produces: a multi-node cluster, GitOps for the deployment files, and anomaly detection across the metrics, logs, and traces it now emits around the clock. Whoever takes the system over next inherits a running production platform to build research on, not a broken prototype to repair first.
A last word of thanks. To my supervisors, Dr. Seriai and Dr. Zellagui, for their trust and for the freedom to rebuild the platform properly. It is the kind of work I intend to keep doing, and to do well. To LIRMM and to ESI Algiers for making it possible. And to my family, above all my parents and my brothers, and to every friend and teammate I worked alongside over these five years. None of this was done alone.
 Figure 26: What five years of hard work, pays off!